


Why you need to include APAC social data in your listening strategy
By Laura DelgadilloMay 27
83% of consumer journeys start with a search. Explore our content hub and learn how you can turn global search data into early signals of demand, risk, and brand perception.
Learn how to track what people are saying about you with brand monitoring tools and how to use them to get ahead.
In 2025, news spreads in seconds, and public sentiment can swing wildly with a single social media post or news story.
Imagine waking up to a viral X post about your company. If you're lucky, it could be praise, but if you're not, it could be a PR nightmare.
In either case, responding quickly when you find your brand at the center of the story is important.
This is where brand monitoring proves especially valuable. Keeping a close watch on what’s being said about your brand online can make the difference between boosting your reputation and scrambling to do damage control.
In fact, studies show a company’s public reputation can account for as much as 63% of its market value. With stakes that high, brands need to actively listen and respond.
This article explores what online brand monitoring is and how you can use it to protect and grow your brand.
Brand monitoring is the process of tracking and analyzing mentions of your brand across various channels, from social media and online news to forums, blogs, and review sites.
It’s like having your brand’s ears to the ground everywhere online. When someone talks about your company, products, or competitors, brand monitoring tools will flag that conversation and turn it into useful data.
At its core, brand monitoring combines social media monitoring (keeping an eye on individual comments, posts, and messages) with social listening (understanding broader trends and sentiment from those conversations).
It goes beyond just counting mentions; it gives you details about the tone of those mentions (is the buzz positive or negative?) and the context around them.
So, if your business is suddenly mentioned hundreds of times on X, brand monitoring can quickly tell you if those mentions are glowing recommendations or frustrated complaints.
You can use brand monitoring tools to cover all sorts of relevant channels, from social media platforms and review sites to online news, blogs, forums, podcasts, and TV mentions. That means you won’t miss any conversations.
In terms of what to track, you'll obviously want to monitor your brand name, and you should also include common misspellings and flagship products. For a larger company, you might also track mentions of your key executives or spokespeople (big news about your CEO, for example, can impact your brand).
Beyond that, follow industry terms and even your competitors’ brand names. This is useful since conversations about your industry or rivals can sometimes have a knock-on effect on your own brand.
Brand monitoring has all sorts of benefits and doesn’t have to overtake your working life. In fact, with help from a tool like Brandwatch, it’s actually really simple to conduct.
Let's look at why it's important.
One of the biggest advantages that brand monitoring brings is reputation management and crisis prevention. By using brand monitoring tools, you catch issues before they turn into real problems.
Responding quickly to complaints or negative press means you can prevent small problems from becoming big crises. This has the potential to reduce reputation damage by up to 70%.
Brand monitoring tools can also help you understand how people feel about your brand, through how they talk about your brand with others, and how they talk to your customer service teams.
Tracking online sentiment (the ratio of positive to negative mentions) is a great way to get a quick overview of brand health.
You’ll also gather unfiltered feedback on what customers love and hate, which is really helpful when it comes to improving products and services.
Remember, brand monitoring isn’t just about your own brand – it also tracks competitors and industry chatter. This is where competitive intelligence comes into play.
Seeing what people say about rival brands can reveal opportunities to outsmart the competition.
For instance, if customers complain about a competitor’s slow support, you can highlight your quick service. Brand monitoring can lead you to ideas that will improve your strategy in real time.
Brand monitoring helps assign a score to your marketing efforts.
You can track spikes in mentions and share of voice when you run a campaign to see if it's cutting through the noise. It also gently guides you away from vanity metrics like follower count, since brand monitoring will get you real audience reaction data instead.
This makes it easier to prove the ROI of campaigns and understand which messages truly stick.
Many customers now turn to social media for help or to share their opinions about certain brands.
If you’re conducting online brand monitoring that covers a range of social media channels, you can respond quickly to questions or complaints. And if you get clever with it, you can even use it as an opportunity to turn potentially negative experiences into positive ones.
A quick, helpful reply not only solves one person’s issue, it publicly shows your brand listens and cares, boosting your reputation in the eyes of other customers.
Brand monitoring is great, but it can be a little tricky to set up for the first time. There’s a lot of data at play, and you may need some time to get used to it all.
However, there are tools out there to guide you through the process, including Brandwatch.
Here's how to get started, ensuring that no important brand mentions fall through the net.
Specialized brand monitoring tools are essential for keeping track of the vast landscape of online conversations.
While you can set up Google Alerts for basic web mention tracking, it only scratches the surface. Google Alerts will send you an email when your keyword pops up in a news article or webpage, which is useful but extremely limited. It won’t catch social media mentions and provides no analytics – just a list of links.
In contrast, dedicated brand monitoring tools like Brandwatch Consumer Research aggregate mentions across the web in real time and give you dashboards to analyze trends, sentiment, share of voice, and more.
Think of it this way: Google Alerts is like a metal detector that beeps when it finds a coin, whereas a full-fledged brand monitoring and social listening platform is like a GPS that finds the coin and maps out all the treasure in the area and tells you its value.
Brandwatch Consumer Research can track your keywords across 100 million+ sources, including social networks, blogs, forums, news sites, and review sites, and it pulls all the data into one place.
It then analyzes the data for you, offering insights like trending themes in mentions or automated sentiment analysis.
Collecting mentions is step one; making sense of them is step two. Simply having a giant list of brand mentions isn’t useful without analysis.
Here’s where features like sentiment analysis come in. Sentiment analysis uses algorithms (and increasingly, AI NLP – that's natural language processing – techniques) to evaluate whether a mention is positive, negative, or neutral.
While not perfect, sarcasm can still fool algorithms, though they’re getting better, it provides a strong overall sense of how your brand is perceived.
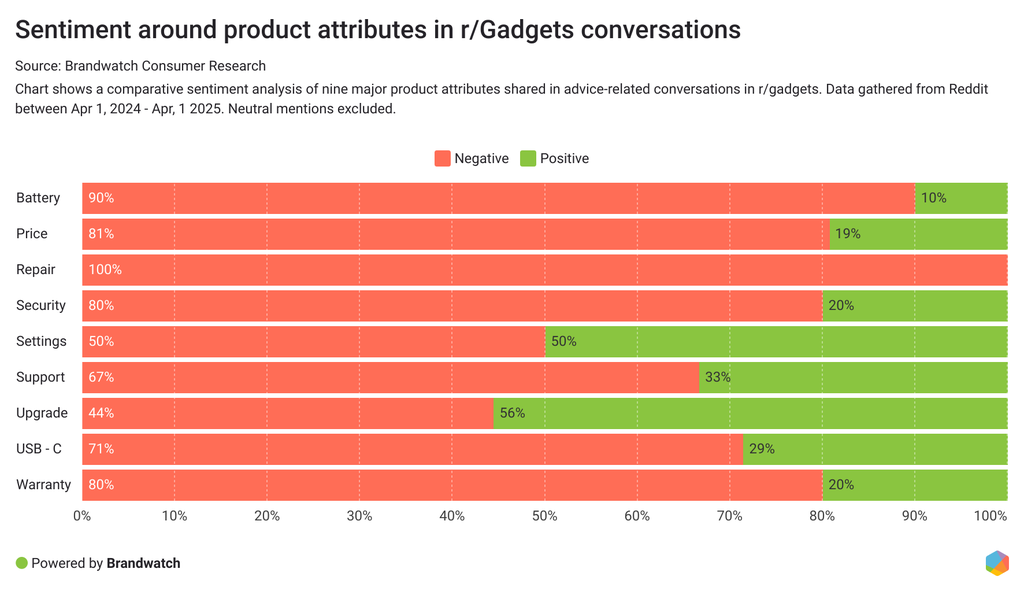
For example, if you launched a new product update, and you see 5k mentions in a week, you’ll want to know how many of those were praising the update versus complaining about it. A sentiment trend chart can show you the “before vs after” sentiment when that update is rolled out.
Sentiment analysis across industries helps brands benchmark how consumers feel. In this example, Brandwatch Consumer Research data shows positive (green) and negative (red) sentiment for brands in different sectors, illustrating how sentiment analysis can reveal industry-specific challenges (for example, the airline sector skews more negatively than fashion). Such visualizations highlight where consumer sentiment is stronger or weaker, helping companies prioritize their focus.
Context is also key. Look at what keywords or topics are frequently mentioned alongside your brand. Are people talking about your pricing? Your customer service? A particular feature? Context analysis (often called topic analysis or theme detection) can break this down.
Advanced brand monitoring even includes AI-driven categorization. It can automatically tag mentions as they come in with topics like “customer service,” “pricing,” “feature X,” and more. This way, you can filter to see everything about a certain issue quickly and contextualize your data.
Another helpful analysis is demographic or geographic insights. Some tools tell you the demographics of those talking about you or where in the world conversations are spiking.
For a global brand, knowing that the most positive buzz is coming from Europe while negativity is rising in North America can inform targeted responses.
Remember, analyzing sentiment and context is meant to help you determine your next move – it’s not just data for data’s sake. If sentiment around a product is dropping, dig in to find out why, then address the underlying issue or adjust the messaging.
If a particular campaign got people excited (a high volume of positive brand mentions), identify what made it work and bring some of that magic to future campaigns.
Simply put, you can’t improve what you don’t measure, and brand monitoring provides that measurement of how people feel about you.
Monitoring without action is like eavesdropping on a conversation and then walking away. The true power of brand monitoring comes when you use it to guide your future decision-making.
This has two main parts: responding to individual mentions when appropriate and making strategic decisions based on insights.
For individual comments or messages, it’s important to have a workflow where your team can quickly respond, especially on social media.
For this reason, many brand monitoring platforms integrate with social media management tools to allow you to reply directly or assign the mention to a team member.
For instance, if someone posts a complaint on social, your monitoring dashboard can send that message to your support team to respond via your official account. You might thank the user or reshare it if there's a shout-out or praise.
A friendly, timely response ensures no one is left hanging, showing the rest of the online community that your brand is actively listening and caring. Brands that feel more human in their communications are more likely to earn customer loyalty.
This is where Brandwatch Social Media Management comes in handy. It’s a tool designed to help you not only schedule and publish content but also manage incoming mentions and messages across platforms.
It includes features that will help you efficiently respond to or join the discussion from a centralized inbox. By uniting listening and engagement, you ensure nothing falls through the cracks.
Beyond one-on-one responses, you should also feed these insights back into your business.
Brand monitoring might reveal, for example, that customers love a competitor’s new feature and are asking why your brand hasn’t done the same. That insight should be shared with your product and PR teams so they can consider a response (maybe a similar feature or hint that you're working on something).
Or you might find a niche community discussing a particular way to use your product that you hadn’t considered. A smart brand might engage that community with more information or even develop a marketing campaign around that idea.
Let the data guide you. The most successful brands are those that listen to their customers and pivot or make changes to their strategy accordingly.
We touched on competitive intelligence earlier as a benefit; as a practice, it’s an integral part of a brand monitoring strategy.
Set up brand monitoring for the names of your key competitors and their major products. This way, you’ll receive the same kind of alerts and insights about their brand as you do for yours.
If their campaign goes viral (positively or negatively), you’ll know. If their customers are loudly complaining about a new policy change, you’ll see it. This information is incredibly useful for context – it helps you understand where you stand in the market conversation.
By keeping tabs on public sentiment around competitors, you can spot weaknesses or unmet customer needs that your brand might fill.
Social media is like having a window into your competitors’ focus groups: customers publicly share pain points and feature requests that savvy brands can use to differentiate.
For instance, if consumers complain en masse about a rival product lacking a certain feature, your team can proactively emphasize that feature in your offerings – seizing a market gap.
It’s also worth monitoring general industry keywords and trends. Such social listening will alert you to hot topics among your target audience. It might even help with trend spotting – being the first to pick up on what consumers are starting to care about.
Companies are increasingly trying to use predictive analytics on social data to catch the next big thing before competitors do. If you see a sudden uptick in conversations about a new topic or concern, that’s a chance to create content around it or address it in your strategy.
The trick is to be proactive, not just reactive, and trend-spotting through social listening offers that strategic edge.
The best brand monitoring tools now use AI and automation to help you sift through the noise.
AI can automatically group similar mentions, detect the overall mood, and even automatically flag anomalies (say, an unusual spike in negative chatter). This means less time spent manually combing through feeds and more time understanding the big picture.
You can even set up real-time alerts for your brand so you get notified on your phone or email when something important happens.
For instance, if hundreds of people suddenly start mentioning your company, you can configure your tool to alert your team when brand mentions cross a certain threshold or when sentiment drops below a set level.
That way, you're always a step ahead when conversations about your brand start to pick up.
In a world where a single viral post can redefine a brand’s narrative, brand monitoring is your safeguard and your secret weapon.
It lets you figure out what people say about your brand online and offline and gives you confidence in choosing your next move.
If you consistently track brand mentions, analyze sentiment, and engage with your audience, you can build a better reputation and strengthen customer loyalty.
The data doesn’t lie – companies that invest in social listening and the best brand monitoring tools see all sorts of benefits, from faster growth to more resilient brand health.
Equip yourself with the best tools and partners as you plan your brand monitoring strategy. The beauty of a solution like Brandwatch Consumer Research is that it helps you understand consumer insights even when a lot is happening in different places, from spotting trends to flagging individual conversations.
Now that AI-powered analysis is on the rise – and enabling coverage across millions of sources – it’s easier than ever to know exactly what’s being said about your brand and why. And with integrated engagement through Brandwatch Social Media Management, you can seamlessly go from insight to action, closing the loop with your customers in real time.
So, don’t let online conversations run wild without your awareness. Take charge of your brand’s narrative by making brand monitoring a priority.
By proactively listening, you’ll not only protect your brand’s reputation; you’ll uncover new opportunities, refine your products, and connect with your customers on a deeper level. Now is the time to start listening.
Consumer Research gives you access to deep consumer insights from 100 million online sources and over 1.4 trillion posts.
Existing customer?Log in to access your existing Falcon products and data via the login menu on the top right of the page.New customer?You'll find the former Falcon products under 'Social Media Management' if you go to 'Our Suite' in the navigation.
Brandwatch acquired Paladin in March 2022. It's now called Influence, which is part of Brandwatch's Social Media Management solution.Want to access your Paladin account?Use the login menu at the top right corner.