[Webinar] Leveraging Social Media Trends for Brand Engagement
Unlock the secrets to staying ahead in the ever-evolving world of social media marketing.
Save your seat
Unlock the secrets to staying ahead in the ever-evolving world of social media marketing.
A lot can happen in a minute…
One minute doesn’t seem like much time, but, as this brilliant visualization from Steven Lewis shows, if you blink, you’ll miss a lot. In fact, one of the problems social listening platforms like Brandwatch face is adding meaning to the big numbers we present.
Minute-by-minute charting – released earlier this week – was worked on tirelessly by our engineering team and although it seems like a small change it makes a big difference in how we can now view, analyze and digest the data Brandwatch provides.
Over the next few weeks we’ll be releasing a cache of content explaining how the feature can benefit your brand. In this post however, we’re focusing specifically on tracking trends and how brands effect and reflect them.
We’ve tracked three of the largest US internet retailers over Black Friday, looking specifically for US mentions of their brand name near the hashtag and phrase “Black Friday”. Note, all charts are based on Eastern Standard Time.
Macy’s: 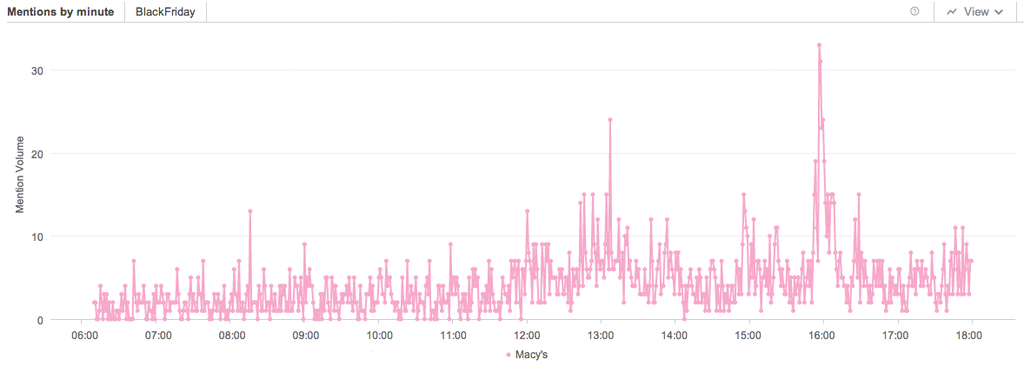
Macy’s received 2,960 tweets relating to Black Friday during the course of the day resulting in two significant peaks.
I cried RT @manofsteele: Women who appear to be Macy’s employees chant, “No Black Friday!‘ pic.twitter.com/vWHjvJRcVh”
— justified agitator (@Awkward_Duck) November 28, 2014
A fairly negative dilemma for the Macy’s social media team – one they would want to find the cause of. With minute-by-minute we can go full CSI-style and break down exactly what caused that spike.
The original Tweet from @manofsteele was generating one to three retweets per minute. His 1,839 followers were sharing the Tweet but not at a rate that would get it trending. However, around 15:51 (EST) @Awkward_Duck retweeted the post to her 27,800 followers, generating 4.18 times more engagement then the previous 10 minutes.
Fascinating stuff – well maybe not for everyone, but if Macy’s social team had got their hands on this type of data at the time they could have attempted to quell this negative tweet. Responding to @manofsteele’s tweet before it was picked up by the influencer would have explained the situation to concerned stakeholders before it started trending.
Walmart: 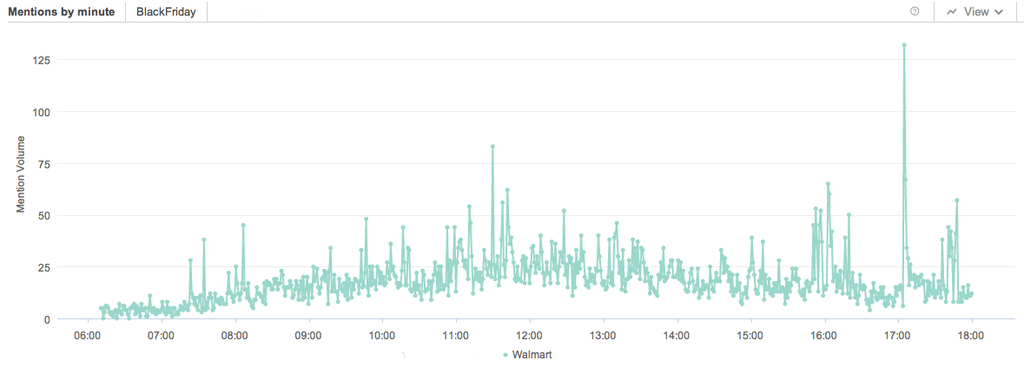
Walmart generated a consistently higher level of tweets per minute (14.47 compared to Macy’s 2.89) and generated over 10,000 tweets in total.
The stand out from USA’s largest retailer is the colossal spike seen at around 17:05. What’s remarkable about this spike is the lack of build up – unlike Macy’s spike there is no increasing trend.
What causes this difference? The influencer. The Vamps (a boyband with over 1.94 million followers) tweeted this which within 60 seconds generated the 132 retweets which, in turn, caused an impressive spike.
Another eye-opening feature included in minute-by-minute charting is the ability to combine the data with other Brandwatch metrics like demographics, sentiment, and topics. This allows us to break down the Walmart spike in unique ways.
Here’s the spike again, but separating the genders:
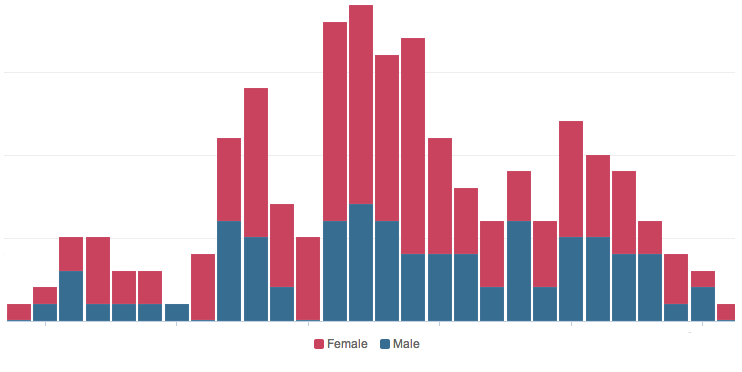 Interestingly, this shows that the ratio of female conversation was remarkably higher during the spike, taking up 70% of the conversation compared to the 55% they took up over the course of the day.
Amazon:
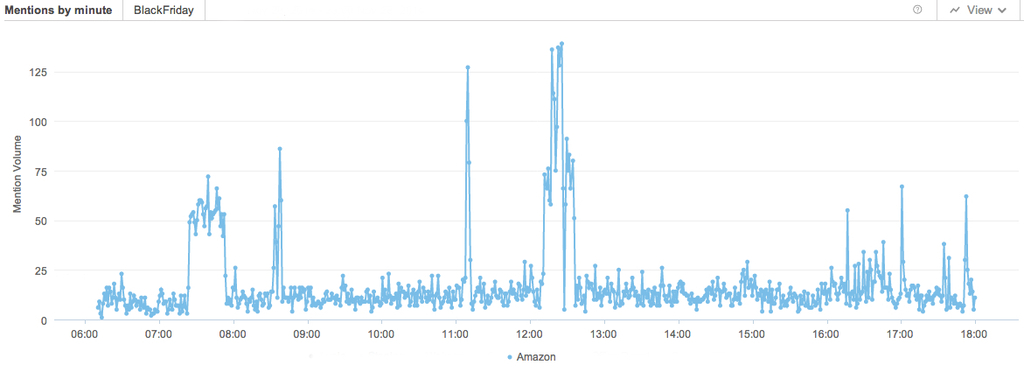 Amazon have a very different minute-by-minute chart when compared to the other retailers. Their spikes rise and fall in line with their online offers – each spike represents a new offer on Amazon that’s being shared online. In fact, by clicking through on each spike we can see how each offer compared to one another:
Understanding where a trend started, how it grew and how it changed over time is vital to those managing networks online.
But looking back or seeing in real-time how sentiment, demographics and topics of conversation break down minute-by-minute is an exceptional feature that will change the way you understand social data.
Offering up analysis and data on everything from the events of the day to the latest consumer trends. Subscribe to keep your finger on the world’s pulse.
Consumer Research gives you access to deep consumer insights from 100 million online sources and over 1.4 trillion posts.
Existing customer?Log in to access your existing Falcon products and data via the login menu on the top right of the page.New customer?You'll find the former Falcon products under 'Social Media Management' if you go to 'Our Suite' in the navigation.
Brandwatch acquired Paladin in March 2022. It's now called Influence, which is part of Brandwatch's Social Media Management solution.Want to access your Paladin account?Use the login menu at the top right corner.