[Webinar] Leveraging Social Media Trends for Brand Engagement
Unlock the secrets to staying ahead in the ever-evolving world of social media marketing.
Save your seat
Unlock the secrets to staying ahead in the ever-evolving world of social media marketing.
What trends can retailers expect to continue or emerge in 2023? Today we’re exploring the top trends in retail that businesses need to keep in mind this year and beyond.
In a recent survey, Statista identified the main reasons why consumers worldwide choose to shop online, and convenience – shopping at any time and without leaving their homes – was the biggest one.
In the last few years, we’ve witnessed the rising conversation around AI, AR, VR, and 3D in the retail sector. This trend has emerged from the need for convenience, which has been accelerated by COVID-19.
Many retail brands have either introduced or started experimenting with new tech options, from virtual try-ons for makeup and clothes to viewing objects in 3D around the house.
How are consumers reacting toward the new retail tech, and what are the biggest business implications?
We looked at emotion-categorized data in related conversations, and joy was the most prevalent emotion. The emotion of joy also accumulated 14% more mentions between September 1 2022 and March 1 2023 than within the previous six months.
As retailers leverage AR and 3D to help consumers try on and visualize products in real life, consumers share their experiences online.
Other consumers discussed the many possibilities that are yet to come with the development of the metaverses.
The metaverse has the potential to transform the retail sector through gamification, providing consumers with a highly immersive shopping experience. Metaverses also offer brands a platform to launch campaigns, gauge reactions, and interact with consumers in real time within the digital storefront. Several large brands have already started experimenting with digital stores in the metaverse, including Home Depot.
Again, convenience is a key driver for online shopping, and new tech like AI, AR, VR, and 3D promise to enhance the experience for consumers. Retailers that can successfully leverage these emerging technologies will have a better shot at meeting consumer expectations and staying competitive in the market.
According to a recent industry study, 90% of consumers are more likely to make another purchase from a business after a positive customer experience.
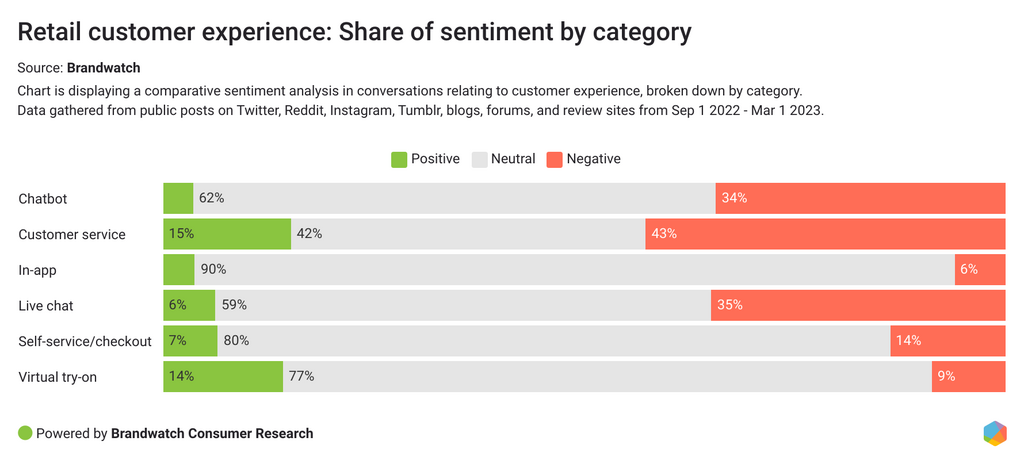
To understand the different aspects of customer experience in retail and e-commerce, we tracked mentions of six different categories in online conversations: chatbots, customer service, in-app shopping, live chat, self-service and checkout, and virtual try-on.
Overall in conversations relating to customer experience, consumers positively discussed factors such as the speed of response and inquiry resolution, accurate product descriptions on the website, and fast delivery.
On the negative side, not getting a response or getting it too slowly was a major complaint. In those conversations, many consumers talked about their frustration with untrained customer service bots that weren't at all helpful and often offered irrelevant answers.
In today’s highly competitive retail landscape, positive customer experience can be a key differentiator for brands to stand out among the competition and help attract new customers.
Convenience remains a top priority for retailers this year.
For many shoppers, convenience may mean different things:
Flexible payment options provide consumers with yet another convenient way to shop: Consumers can pay how and when they want to (terms and conditions apply).
One of our recent posts discussed how “buy now, pay later” payment options influence consumer purchasing decisions. In our latest research, we saw another theme emerge in consumer discussions relating to payments and convenience: “Try before you buy.”
Using this model, consumers can try on clothing and accessories, and even test out furniture in their space before buying. Unwanted items can then be returned within a trial period for free or for a small fee.
Between September 1 2022 and March 1 2023, the try-before-you-buy conversation saw 18% more mentions than in the previous six months. Similarly, a quick Google Trends search showed a growing interest in “try before you buy” in the last five years.
Flexible payment options offer more convenience, enhance the customer experience, and increase customer satisfaction. Happy customers are much more likely to become repeat customers. They are also your company's biggest promoters who'll spread positive words on social media about your brand, encouraging others to try it.
Offering up analysis and data on everything from the events of the day to the latest consumer trends. Subscribe to keep your finger on the world’s pulse.
What can millions of digital data points tell us about emerging trends in the retail industry? Find out in our new report..
Existing customer?Log in to access your existing Falcon products and data via the login menu on the top right of the page.New customer?You'll find the former Falcon products under 'Social Media Management' if you go to 'Our Suite' in the navigation.
Brandwatch acquired Paladin in March 2022. It's now called Influence, which is part of Brandwatch's Social Media Management solution.Want to access your Paladin account?Use the login menu at the top right corner.