

20 Social Media Holidays to Celebrate This May
By Yasmin PierreApr 10
Unlock the secrets to staying ahead in the ever-evolving world of social media marketing.
Published March 8th 2023
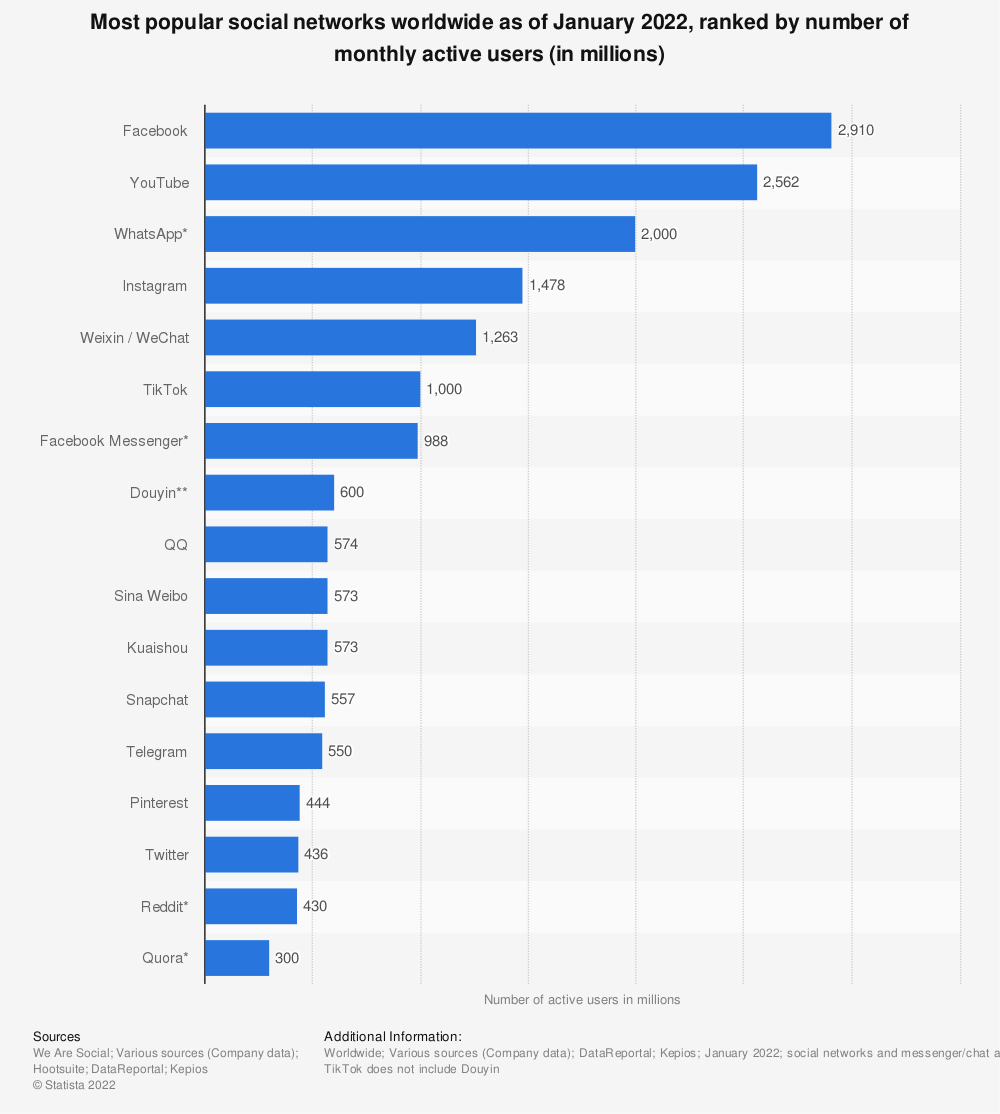
We come across all sorts of interesting stats about social media platforms and users, and we’ve collated the best of them in this bumper facts list. It is a great resource to give context to your social media marketing efforts.
Knowing the statistics behind the social networks can help you adjust your strategies and budget, allowing focused targeting of users.
Want more? Head to our full list of Facebook statistics.
We have a much more extensive list of Twitter statistics here.
We’ve got loads more Youtube statistics here.
Want more? We’ve got a much longer list of Instagram statistics available.
To learn more how to start or improve your TikTok strategy check out our guide.
We also have a much larger list of LinkedIn statistics.
Head here to check out our bigger list of Snapchat statistics.
That’s your fill of social media statistics for now, with just a tiny fraction of the useful stats and facts available out there. We’ll be updating this list as we get new data points that can help your brand grow on social media.
If you’re looking for in-depth insights about your audience, brand or competitors, get in touch with us for a free demo, and see how to boost your social media strategy.
Offering up analysis and data on everything from the events of the day to the latest consumer trends. Subscribe to keep your finger on the world’s pulse.
Which brands are stealing the social spotlight? Here are the latest visual trends in online conversations..
Existing customer?Log in to access your existing Falcon products and data via the login menu on the top right of the page.New customer?You'll find the former Falcon products under 'Social Media Management' if you go to 'Our Suite' in the navigation.
Brandwatch acquired Paladin in March 2022. It's now called Influence, which is part of Brandwatch's Social Media Management solution.Want to access your Paladin account?Use the login menu at the top right corner.