What can millions of online conversations tell us about how we feel about brands, events, and the world around us?
Brandwatch and Crimson Hexagon jointly aimed to investigate that question by looking at emoji use, emotive conversations, and how brands and industries make us feel.
In this new report, we explored three key areas:
1. How we use emojis
Using pictographs has been a part of communication for as long as humans were writing things down. So it is no surprise that emojis have become a part of every form of language we have.
Emojis are a real part of the way we communicate today. Emojis add context to conversations in a way that transcends one language.
Emojis add their own emotion and meaning to our language. Marketers use emojis to present a more human and relatable brand. Even Oxford Dictionaries recognized the role emojis play in communication when they named the ‘face with tears of joy’ emoji as the word of the year in 2015.
So, we were interested in learning how and when we used emojis and what emotions we convey through our use of them.
Most popular emojis
Here are the most used emojis on Twitter in 2018 (click on the right-hand arrow).
Top 20 most used emojis

Top 50 most used emojis

Top 150 most used emojis

Then, using pre-built lists, we grouped emojis into six emotion groups: joy, disgust, sadness, anger, fear, and surprise. For example, disgust included 😷 (face with medical mask) and 😩 (weary face), while anger included 😡 (pouting face) and 😤 (face with steam from nose). To learn more about how we did this, skip to the methodology.
This allowed us to see what type of emotion was displayed most on Twitter, and how that compared to our research last year.
Emoji use, broken down by emotions

We dug into this data and identified the changes from the previous year’s research:
- 75% of the top 20 emojis are the same as our previous report.
- Purple ( 💜) and blue ( 💙) hearts replaced the sparkle heart ( 💖) , in the top 20.
- The fire emoji ( 🔥) also made it to top 20 this year, coming in at number 12 overall.
- People are expressing slightly less joy and disgust this year, and much more fear with their emoji use.
But what about emoji use over time? Do we use more angry emojis when we’re tired? When are we most disgusted? Are we really happier on the weekend? And a question from our personal Twitter feed:
By analyzing the same emotions categories as above by time of day and day of week, we attempted to unpack these questions (click on the right-hand arrow).
Emoji emotions by time of the day

Emoji emotions by day of the week

Joyful Twitter conversation was in line with expectations: people are least happy during their local mornings, and most happy on Fridays and Saturdays. This led us to dive into the more interesting findings.
First, we looked at the rather big peak in disgusted conversation that happened at 3am. What drives this spike in disgusted Tweets in the middle of the night?
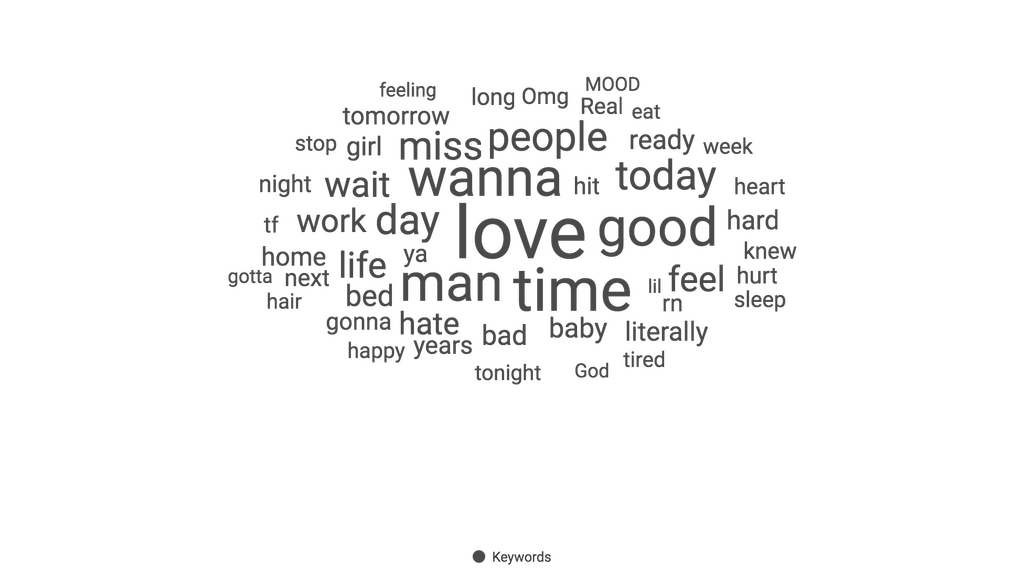
Seeing these topics of late night Tweeters, we were surprised to see keywords like “love”, “miss”, “heart”, “boyfriend” and “wait” continuing to appear. It seems that we get most lovesick at 3am.
Then we asked, why did anger peak on Thursdays?
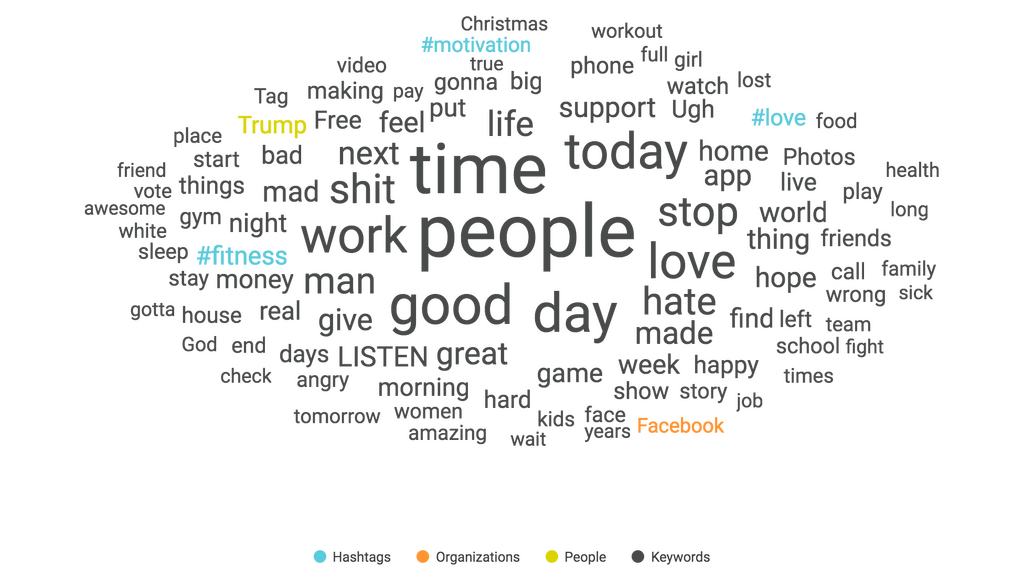
When we analyzed the major keywords in these conversations, two of the biggest trends were work-related topics like “work”, “job” and “money” and fitness-related topics like “workout”, “gym”, and “health”.
In addition to keywords, we were able to automatically identify the top organizations and people driving angry Thursday conversations. As you can see in the topic cloud, only one of each made it into the top 100 topics.
Finally, to show the nuance of emoji use, we were interested in looking at emojis whose emotions evolved from their original intention.
Emojis with non-traditional emotional meaning
Anyone who spends enough time online know that the creative and often viral ways we use emojis can often reveal more complex emotions than the icons might represent. We use the fire emoji ( 🔥) after our friend makes a funny insult, or we see the bread emoji ( 🍞) as a proxy for money or “dough”.

These culturally accepted uses of emojis make traditional social media analysis, especially artificial intelligence and natural language processing a bit more complicated.
But what’s obvious to everyone on Twitter, might confuse an algorithm trained to associate the bread emoji with food. One of the top 50 emojis, the skull emoji ( 💀), is a perfect example of this.
Traditional assumptions about that emoji might be that it would be used negatively, when discussing literal death, or in scared/fearful conversations.
Just as likely, people use the emoji when something is extremely funny, alongside phrases like “I’m dead” or “you’re killing me” after jokes or memes online.
You can see in the topic cloud, when people use the skull emoji, several “crying laughter” emojis and variations on LMAO arise as major keywords and topics.
To understand this audience of people most likely to use skulls during jokes, we wanted to find out how this group differs from the average Twitter user.
Below is a list of the interests that best predict who tends to use the skull emoji in funny or joyful ways:

This type of analysis is particularly useful to marketers interested in knowing whether using different language and emojis will resonate with their audience.
And in general, when analyzing emotions of any kind on social media, it’s important to consider the impact of these cultural nuances and modern day slang.
2. How we share emotions online
Social media is frequently the lifeblood of public thought on current events, pop culture, news, and everything in between. With emotion analysis, we can analyze that pulse, and truly understand public sentiment around any topic.
We decided to look at two important instances where emotion analysis helped paint a deep picture of public sentiment: during events and related to global trends.
Emotions around events: Super Bowl case study
The Super Bowl is one of the biggest sponsoring events of the year, with the franchise collecting upwards of 5 billion USD in ad spend. But how did the viewers of those ads feel during the big game in real time?
First, we wanted to see if we could predict the outcome of the game in real-time by looking at the change in emotions of the two fanbases of the teams in the game.
We identified a sample of people who identified as either Patriots or Rams fans in their bio or tweeting pro-team hashtags or messages. Then, we were interested to see how emotions around these two groups changed throughout the big game (click on the right-hand arrow).
Happy conversations during the hours of the game

Sad conversations during the hours of the game

With the game historically starting out with three quarters without a touchdown, its unsurprising to see both fanbases get increasingly sad and decreasingly happy in the first couple hours of the game.
In case you missed the game, in the last quarter the Patriots pull away from the Rams and go on to win the Super Bowl. So it’s unsurprising that around 9pm EST, Rams fans start to get more sad than Patriots fans. Respectively, joyfulness from Patriots fans peak at 10pm, at the end of the game.
Since this was pretty expected, we were also interested in looking at how people with different affinities and interests discussed the game.

We found that compared to the average Superbowl viewer, people interested in wine and/or beer overwhelmingly discussed watching the game joyfully.
Alternatively, people interested in food & drink, and those interested in reality television, discussed the game almost as sadly as joyfully.
This kind of analysis can be extremely useful for brands and companies in these sectors as they plan their 2020 Superbowl ad campaigns.
Emotions around trends: wellness and dieting case study
When it comes to health, fitness, and in particular dieting and cleanses, tell us how you really feel.
We looked at all the emotions around people discussing dieting over the past 6 years.
We can see that joy really spikes each January, particularly in January 2016. Resolutions and the New Year are the cause, and reality sinking in February plays its part as well. Joy did not necessarily stay high after January, however, suggesting a lingering dissatisfaction after this early boost.

Brands in the space can really work to keep this boost going, while also recognizing that resolutions may not have been so realistic.
We then diced up this conversation by source, and analyzed how people expressed their emotions on several different types of sites when discussing their diets and cleanses.
On the more interpersonal sites such as blogs and forums, people were a lot angrier, with other negative emotions such as disgust and sadness being prevalent.

Instagram was by far and away the happiest site, with joy leading more than 30% of all conversation.
This suggests content marketed toward Instagram needs to account for the tone of the site, and should be positive. When trying to create ads for forums, perhaps it would be best to not focus on the negativity, but ways to shift the negativity and match the tone of the members.
But how do different groups discuss their diet and food cleanse experiences? Are there regional differences? We wanted to find out.
The chart below shows the leading emotions as part of each diet’s conversation.

The “Master Cleanse” and juice cleanse conversation was particularly happy. However, a bit of disgust crept in alongside that in the juice cleanse discussion, perhaps owing to the reputation of green juice and associated unappetizing products.
Unique to these diets, anger was prominent among the dairy- and gluten-free crowds, suggesting a frustration with availability, particularly among the gluten-free.
Acknowledging the difficulties with availability, particularly as these diets become more popular, will help brands new to the space develop a more positive reputation among these dieters.
| Top emotions in diet conversation | Africa | Asia | Australia | Europe | North America | South America |
| Anger | 18% | 17% | 21% | 23% | 24% | 20% |
| Fear | 15% | 9% | 12% | 17% | 16% | 11% |
| Disgust | 13% | 13% | 12% | 11% | 12% | 13% |
| Joy | 22% | 44% | 32% | 27% | 28% | 40% |
| Sadness | 32% | 17% | 23% | 22% | 20% | 16% |
When looking at emotional breakdown by region, overall Europeans and North Americans are less emotional, especially less positive, across the board when discussing their diets.
Especially when Americans discuss their diets, they are a lot less happy and a lot more angry, while on average, South Americans and Africans are the most happy to talk about their diets.
3. How do brands make people feel?
Examining how emotions are shared online doesn’t only give us a glimpse into how people feel about events, trends, and current events. These types of analysis can also add context to brand health monitoring, or give temperature checks on entire industries.
Consumer emotions can describe how marketing campaigns go or predict how PR crises will affect you, so every brand and agency should know the implications of emotions on their work.
The following chart looks at industries as a whole, and shows how conversation about each industry differs from the average brand.

These are among the most important takeaways for brands:
- In line with past research on the customer service nature of their shares of voice, financial service brands and airlines have the most angry conversations.
- A lot of the angry conversation around customer tech is coming from chatter on Reddit specifically. This is because Reddit is a forum frequently used to get information and advice about tech products from other users.
- Restaurants have the most disgusted conversations of any industry. This is likely due to the nature of the industry. For instance, when people are upset with other brands, they might not feel disgusted, but since restaurants deal with food, disgust is over-indexed.
- TV had the most sad conversations, mostly due to the reason people frequently talk about TV networks: when they are live-tweeting shows as they watch them. E.g., when a sad thing happens on This Is Us, NBC will likely see an increase in sad conversations.
The following chart carousel adds even more emotional context to these industry conversations, showing the top emojis for each sector.
Most used emojis for airline brands

Most used emojis for alcohol brands

Most used emojis for automotive brands

Most used emojis for CPG brands

Most used emojis for consumer technology brands

Most used emojis for fashion brands

Most used emojis for financial services brands

Most used emojis for restaurants

Most used emojis for retail brands

Most used emojis for telecom brands

Most used emojis for TV networks

Case study: Anatomy of a PR Crisis
Because customer sentiment affects brand health and subsequently, brand loyalty, so much, we were also interested in unpacking a recent PR crisis.
Specifically, in asking this question: in this age of 24-hour news and stories quickly becoming viral, how do emotions change throughout the course of a brand crisis?
For this, we looked at one of the recent stories about customer outrage against a popular fashion brand. The following chart shows the emotions within the mentions of this brand before, during, and after the crisis.

Prior to any coverage of the controversy, conversation around this brand was pretty low, and predominantly positive. Then as you can see on February 8, all conversation skyrocketed, with disgust driving most emotions.
As the news progressed, initial disgust went down, but anger and sadness remained high.
But then by a week out, something interesting happens. The conversation around the brand was still centered around this crisis, joyful conversations began to increase again, indicating a pivotal time for the brand where the crisis turned almost into a joke.
While people stayed relatively sad and angry, the internet’s emotions got more nuanced, memes started being created, the disgust subsided, and overall volume of conversations reached near-normal levels.
Using emotions in your work
How do consumers really feel about your brand? What was their response to your latest campaign? When your customers use the thinking emoji ( 🤔) when talking about your industry, what do they mean?
Sentiment analysis always only told part of the story. It’s now easy to dig deeper and get more valuable insights, at the click of a button.
Emotion analysis can inform your strategy, explain campaign performance, gauge the effect of crises or current events, and help you better connect to your customers on a human level.