The State of Social Report 2018
The Social Outlook
From benchmarking brand engagement to audience demographics, learn the social media stats shaping 13 industries
Social media has empowered all businesses to act faster, perform smarter, and fuel every decision with intelligence.
We unpacked the social engagement, consumer insights, biggest trends and brand health of 13 industries. Learn what millions of conversations can tell us about over 250 of the biggest organizations.
Whether a part of a brand’s voice, a channel for customer support, or a resource to extract customer and industry intelligence, social media is a key part of more and more business functions.
Teams beyond marketing, from customer service to product R&D, are collecting and analyzing online conversations to perform their jobs better.
As the world’s leading social intelligence provider, we compile this annual report that takes a step back and looks at the state of social and what it means for businesses.
Analyzing over two hundred million conversations about the the biggest brands, we curated the most important social insights of 2018 to help you can drive smarter, more successful business decisions.
Social content engagement
To take your social media strategy to the next level, it’s important to understand the global social landscape of your industry—including how your competitors behave.
What is the “norm” for your industry? Do you produce the volume of content your audience expects of your industry, and is your content received as well as your competitors?
Brand and industry health
As a huge source of unfiltered consumer thought, social media analysis should be the first step in monitoring your brand health.
Are customers satisfied with your brand’s promise? How are they engaging with your brand and products, and is this better or worse than the rest of your industry? Are there any parts of your buyer journey that are particularly weak?
Benchmarking the emotions and sentiment surrounding your brand and industry reveals important issues to address as well as potential opportunities for your social program.
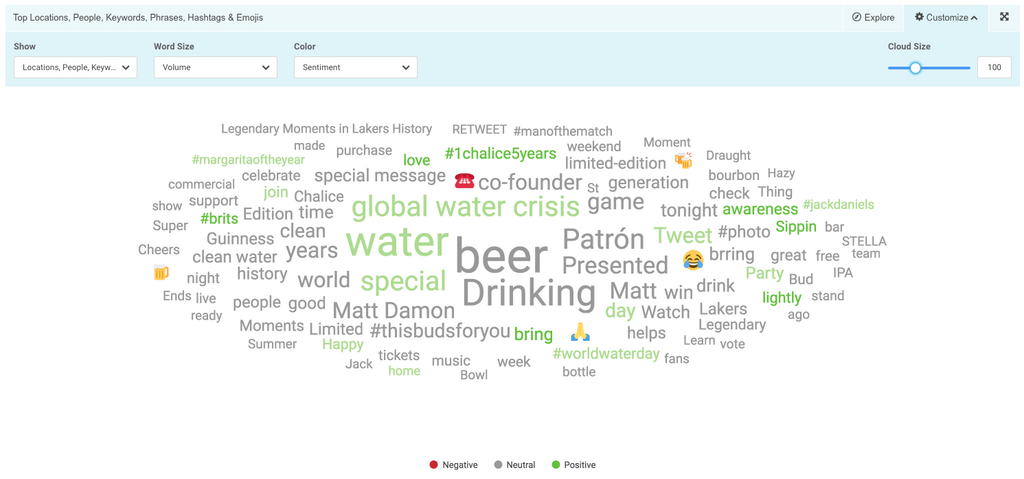
For instance, the most positively discussed industry in 2018 was the alcohol industry. We found that one of Stella Artois’ advertising campaigns (which we discuss below) and the 2018 World Cup’s effect on beer consumption helped influence this.
Among the most negatively discussed industries were hotel brands, financial services, and companies in the pharmaceutical and healthcare industry.
Sentiment of conversations around 13 industries

This is an interesting shift from last year. In 2017, airlines and telecom companies represented the most negative industries.
Brands in the the airlines and telecom industries had the highest percentage of owned social media conversation of all the industries we looked at in 2018. This was probably due to their bigger focus on customer service and responding to the issues highlighted by their audiences.
We’ll be on the lookout to see whether pharmaceutical and financial services companies invest more in social customer care in 2019.
Percent of owned vs. earned social media conversation
| Audience Activity | Brand Activity | |
|---|---|---|
| Fashion | 99.6% | 0.4% |
| Television | 99.1% | 0.9% |
| Retail | 98.8% | 1.2% |
| Automotive | 98.6% | 1.4% |
| Pharma/Health | 98.1% | 1.9% |
| Financial Services | 98.0% | 2.0% |
| Energy | 97.8% | 2.2% |
| Consumer Goods | 97.6% | 2.4% |
| Alcohol | 96.6% | 3.4% |
| Consumer Technology | 94.9% | 5.1% |
| Hotels | 90.3% | 9.7% |
| Telecom | 85.9% | 14.1% |
| Airlines | 81.6% | 18.4% |
We examine each industry in depth and find the brands and market trends influencing differences in sentiment in our spotlights below.
Industry spotlights
While it’s important for brands to monitor their place in the greater market landscape, each industry has particular challenges and objectives which forge their unique relationships with social media.
However, looking at the entire multi-industry landscape together, we were able to identify a few common trends this year, that impacted several industries.
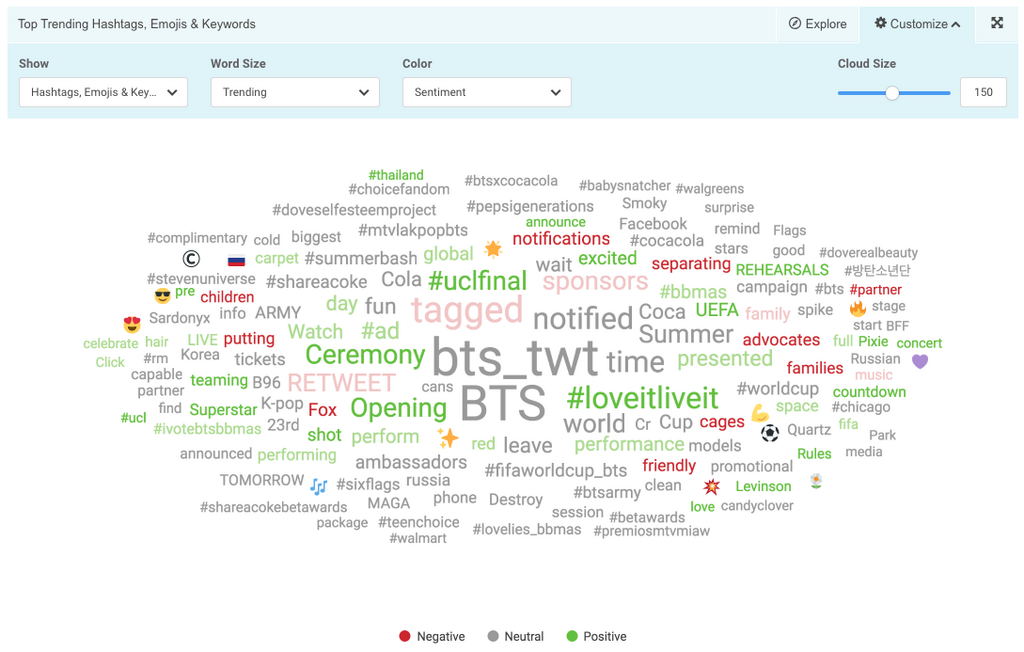
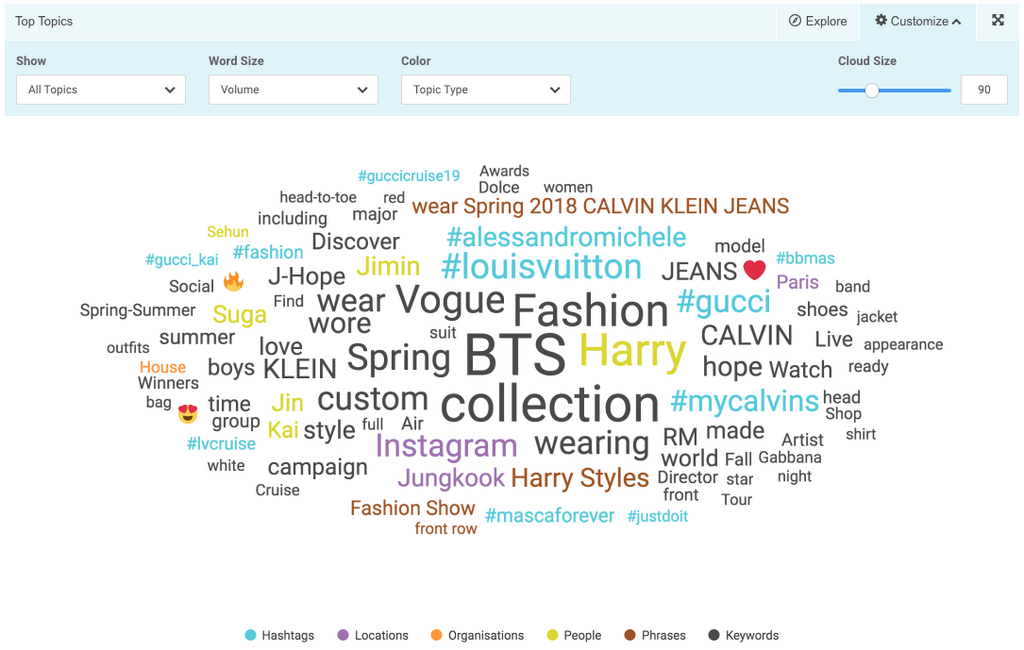
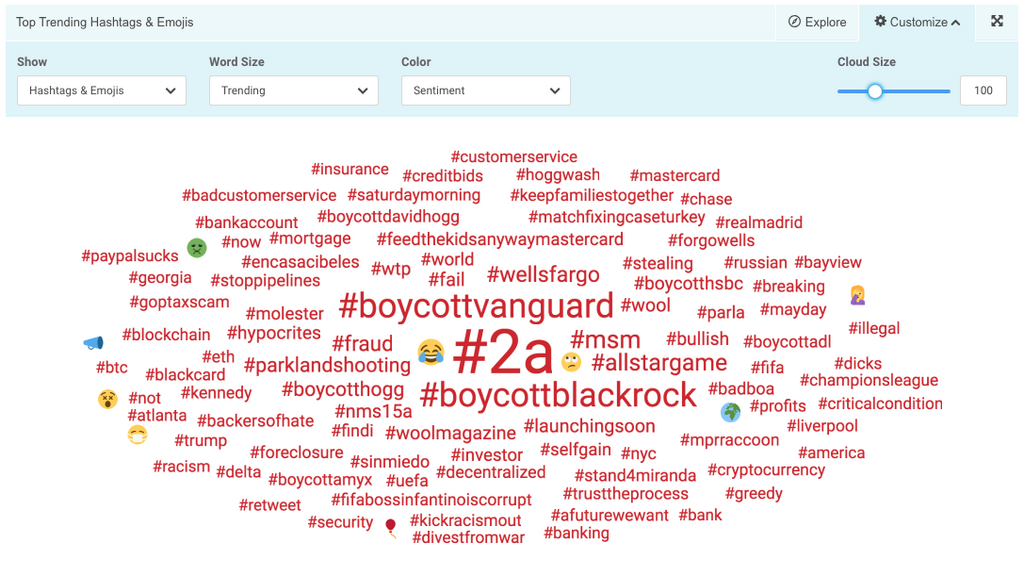
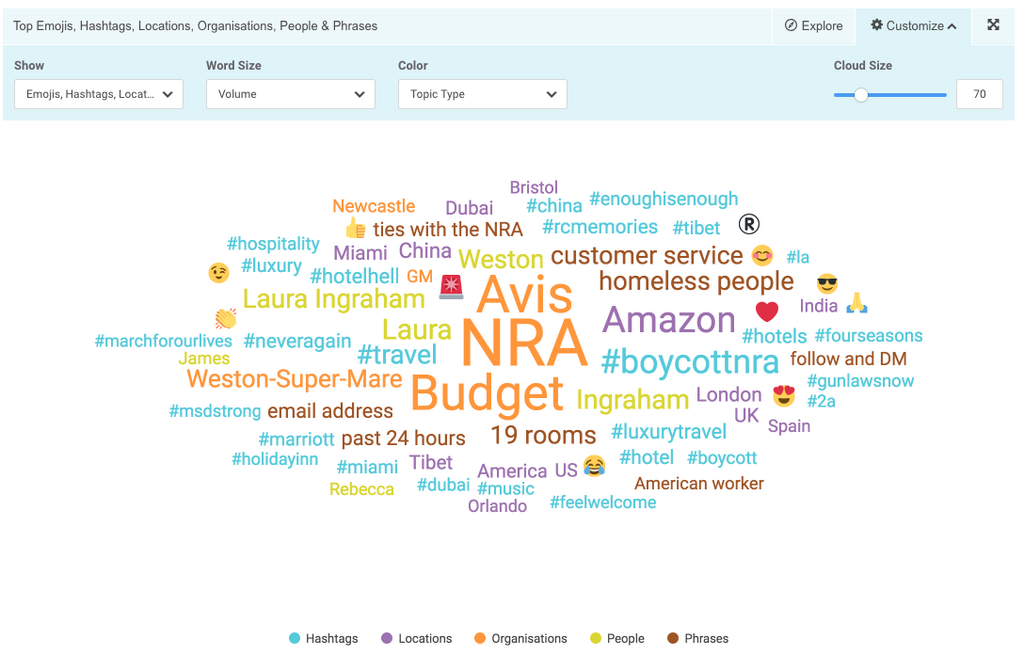
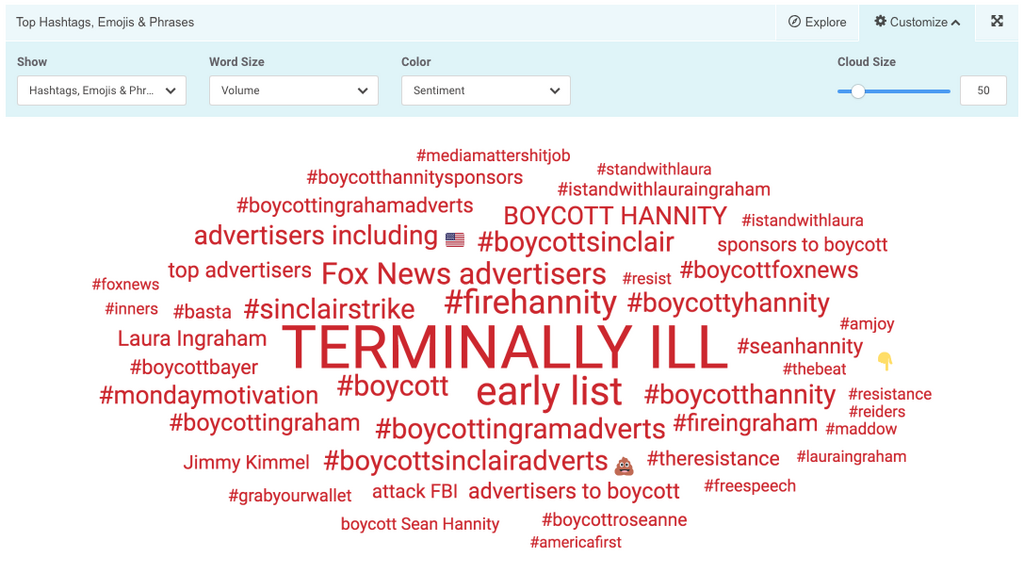
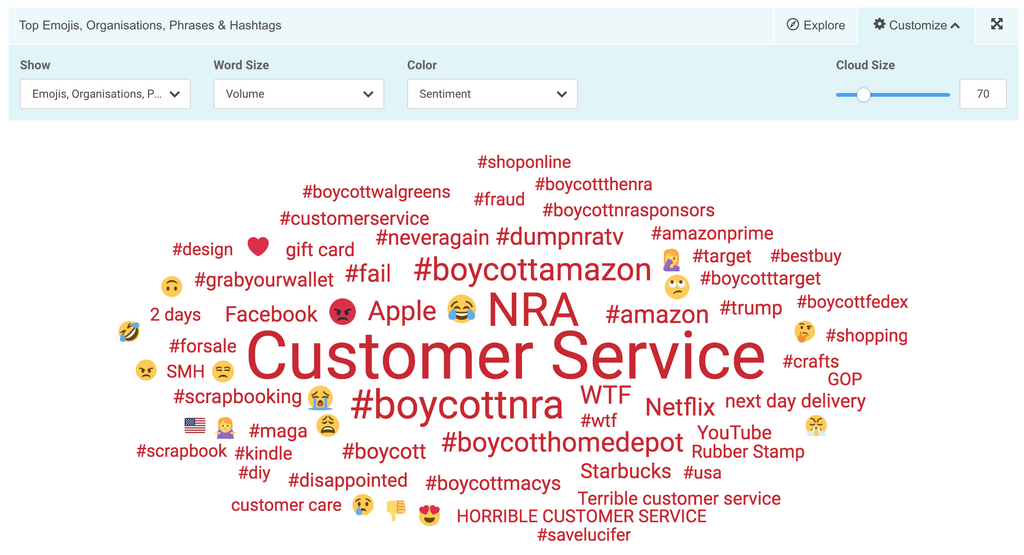
For instance, K-pop band BTS was brought up in relation to both CPG brands and fashion brands. And due to the polarizing US political and social organization, the National Rifle Association (NRA), consumers on both sides of the aisle called for boycotts of brands in several industries because of their association (or lack thereof) with the NRA.
The following section provides an overview of each industry’s relationship with social, a snapshot of their average customers, and a look at the trends and events that shaped their social presence in 2018.
1. Airlines
2. Alcohol
3. Automotive
6. Energy
7. Fashion
9. Hotels
10. Pharmaceutical & Healthcare
11. Retail
13. Television
Airlines consumers compared to average social media user

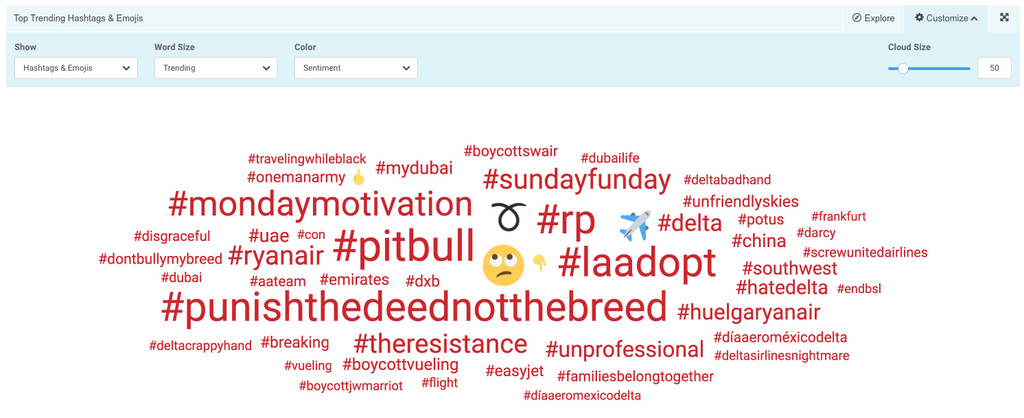
Trending conversations in 2018

Alcohol consumers compared to average social media user

Trending conversations in 2018

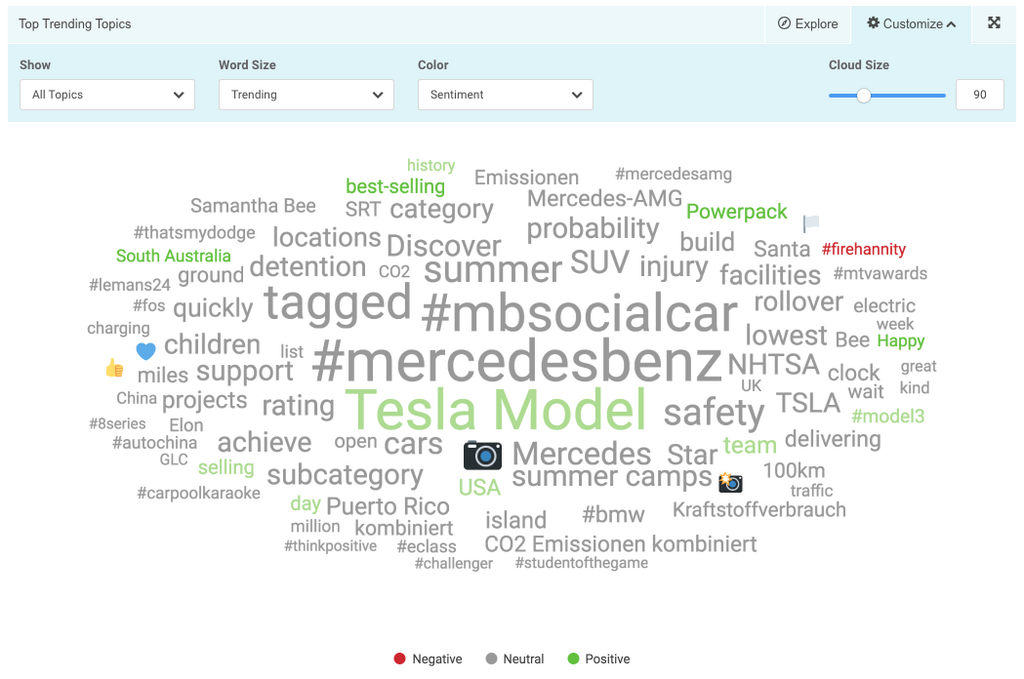
Automotive consumers compared to average social media user

Trending conversations in 2018
CPG consumers compared to average social media user

Trending conversations in 2018
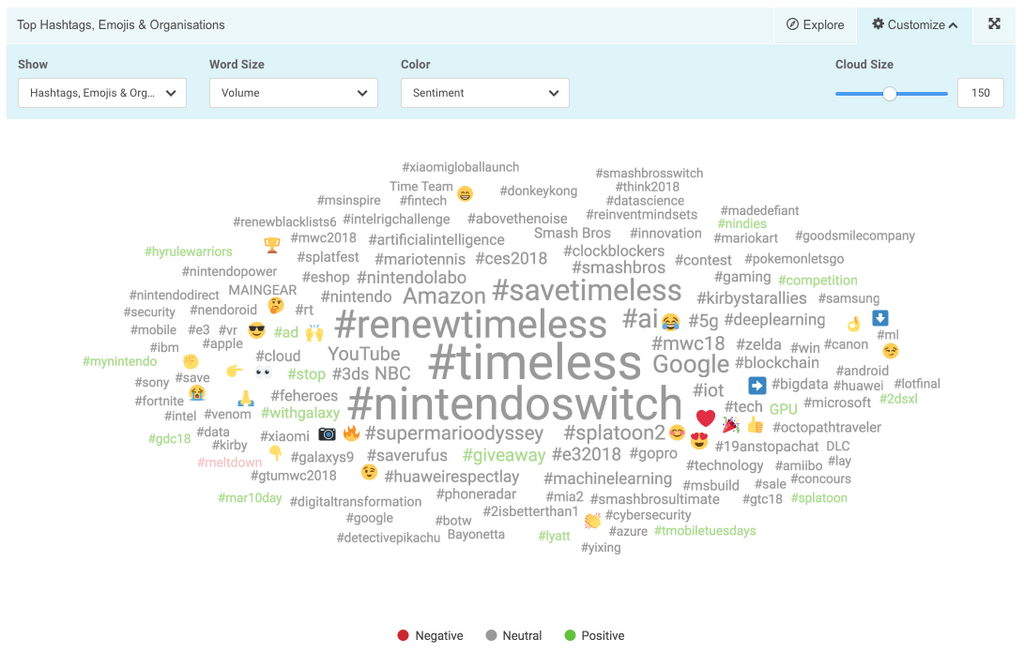
Technology consumers compared to average social media user

Trending conversations in 2018
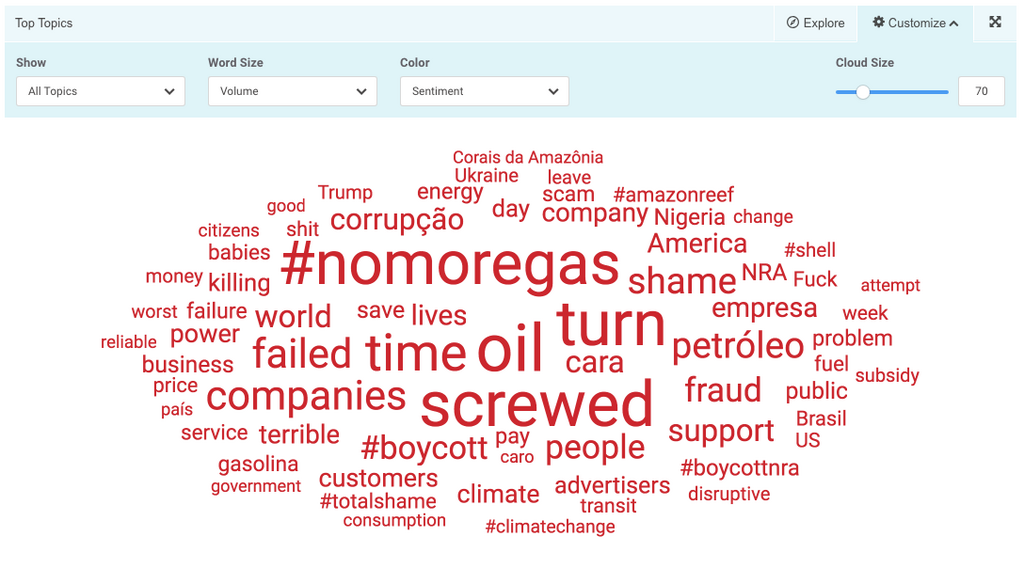
Energy consumers compared to average social media user

Trending conversations in 2018
Fashion consumers compared to average social media user

Trending conversations in 2018
Financial service consumers compared to average social media user

Trending conversations in 2018
Hotel consumers compared to average social media user

Trending conversations in 2018
Health industry consumers compared to average social media user

Trending conversations in 2018
Retail consumers compared to average social media user

Trending conversations in 2018
Telecom consumers compared to average social media user

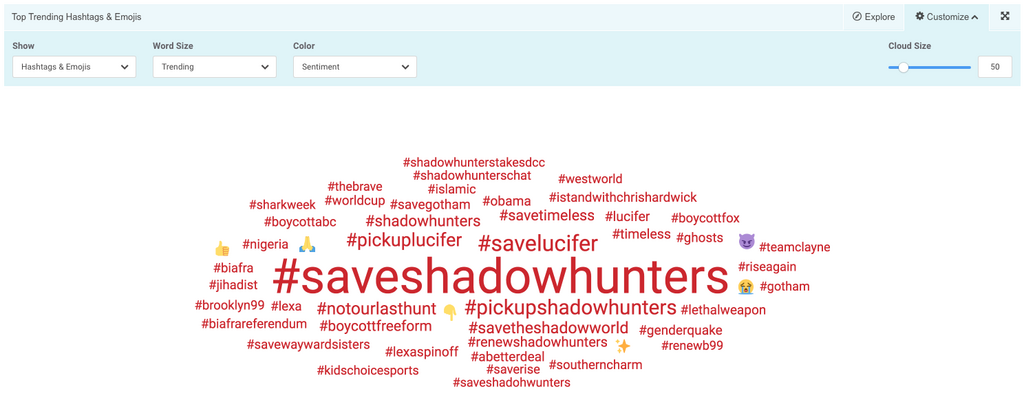
Trending conversations in 2018
TV Networks consumers compared to average social media user

Trending conversations in 2018
Closing notes
It’s fundamental for brands to understand how their company fits into the lives of their customers. An overlooked part of that knowledge is the understanding of how your company and industry fits in the larger online landscape.
For companies targeting the complex consumer on social, it is vital to think outside-of-the-box and consider how the activities of different industries inform, influence and affect one another.
Every touchpoint, every interaction your customers have with your brand should shape your marketing, sales and overall business strategies. Understanding who those customers are and how they experience your products, your competitors, and brand outside your industry are the cornerstones to connecting and keeping them.