logo

Covid-19 Daily Bulletin 27/07: Cities on the Move

Checking in on movement in major cities

Welcome to a new week of bulletins. Today we’re revisiting city movement data to see how things are developing.

Make sure to sign up for bulletins by clicking the button below.

Subscribe

Major city movement revisited

As lockdown restrictions in many places are lifted, more of us are on the move again. But what does that look like in major cities around the world?

To investigate, we used Citymapper’s Mobility Index data. This shows us the percentage of people moving in major cities in comparison to ‘normal’ times.

In the chart below you’ll see how each city was bustling in early March, how movement then dramatically dipped, and how things are now beginning to recover at different rates.

Of all the cities we’ve looked at, Paris is now comparatively the busiest. At its lowest point (during lockdown on April 4), only 4% of the city was moving compared to normal levels. This weekend, that number hit 66%.

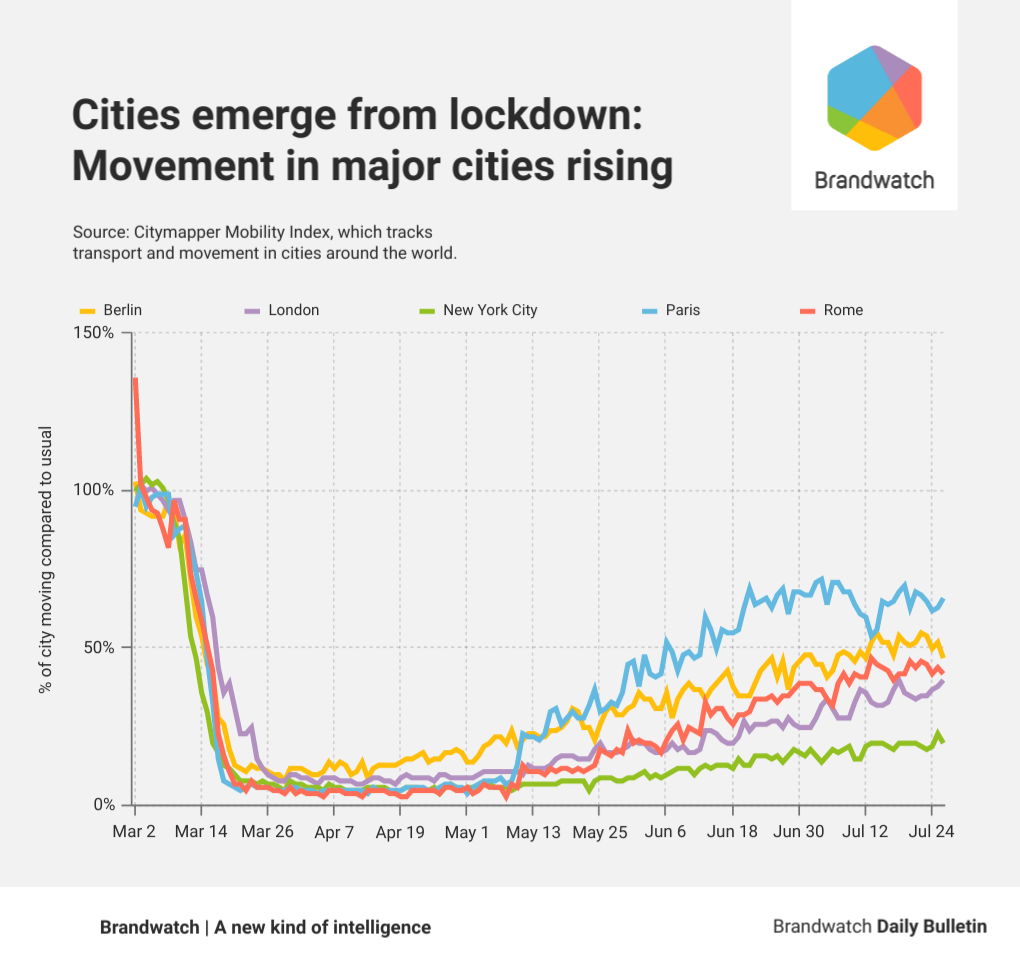
Berlin was just behind Paris, with 52% of the city moving on July 25. It’s a stark difference to its lowest point on March 23 when movement stood at just 8%.

Rome – one of the worst affected cities during the height of the European outbreak – hit a low point on April 3, with just 3% of the city moving compared to normal. On July 25, that number hit a promising 44%.

Meanwhile, 38% of Londoners were moving on July 25. That’s a significant increase from the city’s lowest point of 7% on April 4.

Of the cities we usually study, New York has consistently had the lowest percentage of people moving around. At its lowest point on April 18, only 4% of the city was moving compared to normal times. That has increased, reaching 23% on July 25, although it’s still well behind the movement in European cities outlined above.

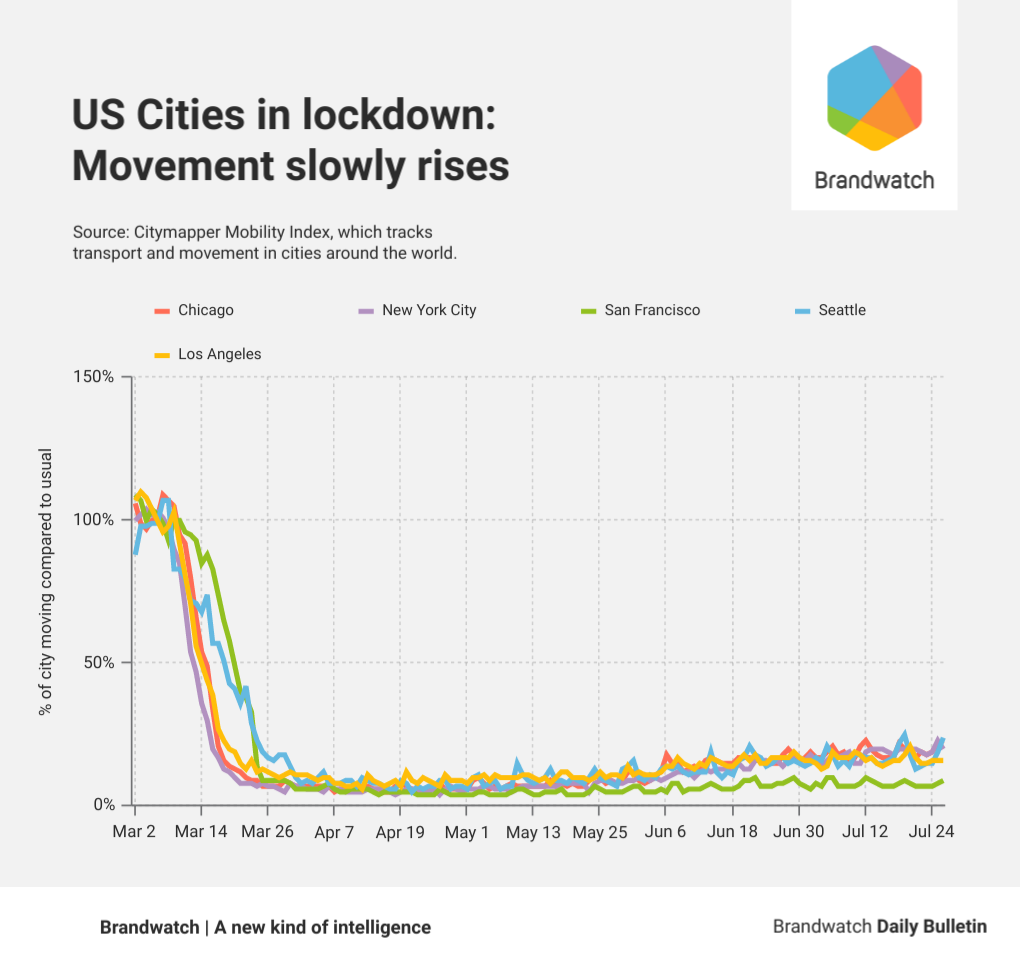
We wanted to see how other major cities in the US were faring. While New York’s movement numbers are low, the city is doing pretty well compared to San Francisco.

On April 9, its lowest point, only 5% of San Fran was moving compared to normal times and that number hasn’t improved much at all. This weekend only 9% of the city was moving and a Stay Home Order is still in place.

The other major US cities we studied tended to show a similar story in terms of how movement is changing. Compared to normal times:

  • 5% of Chicago was moving on April 7, its lowest point. On July 25, 22% of the city was moving.
  • 7% of Seattle was moving on April 11, its lowest point. On July 25, 19% of the city was moving.
  • 7% of Los Angeles was moving on April 11, its lowest point. On July 25, 16% of the city was moving.

As we’ve illustrated in many of our bulletins, there is no one-size-fits-all narrative around the pandemic and how people are affected by it. Brands must respond to the needs of people where they are, and they must also keep an eye on how those needs change.

Get more in-depth data

Don’t miss out on our bi-weekly report looking at consumers and how their behavior has changed due to Covid-19.

Head here to find out more and get signed up.

Thanks for reading

That’s it for today. Don’t miss our future bulletins by subscribing here.

Stay safe,

Brandwatch Response Team

logo
Digital Consumer Intelligence

Runtime Collective Limited (trading as Brandwatch). English company number 3898053
New York | Boston | Chicago | Austin | Toronto | Brighton | London | Copenhagen | Berlin | Stuttgart | Frankfurt | Paris | Madrid | Budapest | Sofia | Chennai | Singapore | Sydney | Melbourne

Privacy Policy

Update subscription preferences

Unsubscribe

We value your privacy

We use cookies and similar technologies to personalize ads and content (including by sharing data with Google), to measure site performance, and to improve your experience. Learn more in our cookie policy

Privacy & Safety • Terms of Service

No, take me to settings
Yes, I agree
More info.

By using our site you agree to our use of cookies —