US Election Bulletin 09/16: Latest Poll Data and Trump the Motivator

The data is in.

Welcome to our third US Election Bulletin. This week we have our regular poll results plus data on who voters want to see in the White House come 2024, what they think of the candidates’ health, and what’s motivating them to vote.

Don’t miss our weekly polling data. Click subscribe now.

SUBSCRIBE

The results: Joe Biden: 46%, Donald Trump: 42%, undecided: 9%

Using Brandwatch Qriously, we surveyed 3,391 American adults from September 10 to September 13, 2020. The above results come from the 2,065 respondents who say they are likely to vote or have already voted by mail in November’s election. (After weighting, this is 57% of the overall sample).

Joe Biden leads, with 46% of these respondents saying they’re likely to vote for him, but is down one point from last week’s poll. Donald Trump’s support has gone up by one point to 42%. A further 9% of likely voters are still undecided on who they will vote for.

We want to be as transparent as possible with our polling data, so we’re releasing it all along with our bulletins. If you want to have a dig around or do your own analysis, you can find our tables and the raw data here.

There has been little change across our headline figures since our first results three weeks ago, but that doesn’t mean there aren’t shifts under the surface. One such shift we’ve found is present among likely voters aged 55+.

We’re seeing clear signs that Trump is gaining support from those aged over 55, and he now holds a comfortable lead over Biden. This will be worrying for the Biden campaign. According to our survey, 71% of the 55+ age group are likely to turn out to vote, compared to 56% of the 35-54s, and 42% of the 18-34s. These numbers are in line with previous election turnouts.

That said, Biden’s support amongst the 18-24 age group is very strong, clocking in at 58% compared to Trump’s 25%. But if Biden can’t convince this younger crowd to show up in numbers to vote, that won’t count for much.

Speaking of which…

What will get people to the polls?

We also surveyed people about what will motivate them to get out and vote on election day. Mobilization is obviously key, especially during the pandemic, so candidates will be doing all they can to get their supporters raring to go to the ballot box.

Here’s what likely Trump voters told us.

And here’s what Biden’s likely voters told us.

While their motivations differ, they both agree that Trump himself is a major reason to get out and vote. For Trump’s likely voters, 65% cited their support of him as their motivation to vote. 51% of Biden’s likely voters cited opposition to Trump as theirs.

While 29% of likely Biden voters said their support for him will get them to the ballot box, it’s clear that, right now, this election is all about Trump. Trump will have to lean on this framing as his campaign struggles to whip up fervent opposition to Biden. Just 11% of likely Trump voters cited opposition to Biden as their main motivation to vote.

Looking ahead to 2024

We also asked our respondents to look ahead to the distant future – 2024 – when we’ll go through this whole process again.

The question we asked depended on who the respondent said they would vote for. Let’s start with Biden’s likely voters. We wanted to know if they would like to see Biden stay in power for two terms.

While the most popular option is Biden serving two terms (45%), that still leaves over half of his supporters who are either unsure or only want one Biden term. This comes after earlier suggestions Biden was only aiming for one term, although there are now signs he wants two. Our results suggest Biden might have the most to gain by avoiding a definite position on the matter.

Let’s turn to Trump’s likely voters. If he wins, come 2024 he’ll have served the full two terms the Constitution allows and someone else will have to run. We wanted to find out who his supporters would like to see take his place.

The current vice president Mike Pence came in as the number one choice in our survey. As a hugely prominent figure and staunch Trump supporter, this comes as no surprise. But one of the most popular choices appearing just behind Pence questions the Constitution itself.

Over a fifth of likely Trump voters would like to see him run for a third time, and Trump himself has suggested that he may seek a third term. This would violate the 22nd Amendment which bars people from being President more than twice. Are these respondents saying they want the Constitution to be amended? Ignored? Or are they just saying what they’d like even if they know it can’t happen? This is certainly an issue to watch.

Of course, 2024 feels like it’s a lifetime away. Do voters even think either candidate will be healthy enough to run the country by then?

Health concerns

From jumbled up sentences to drinking from a cup of water, both Trump and Biden have seen their health attract a lot of attention. We wanted to find out if the attention given to these issues has filtered through to the electorate.

In this week’s survey, we asked respondents to tell us if they were concerned about health issues and what they thought of the health of each candidate.

Here’s what they told us.

Biden saw the most people saying they were concerned about his health (27%). Another 20% are concerned about both candidates, while 12% of voters say they have health concerns about Trump.

With 41% who are unconcerned or haven’t considered the issue, there is still fertile ground for personal attacks from both sides on this front. That said, Biden is looking a bit more vulnerable to them than Trump.

Let’s flip the issue. Here’s how things stand with likely Trump and Biden voters who describe either candidate as ‘very healthy’.

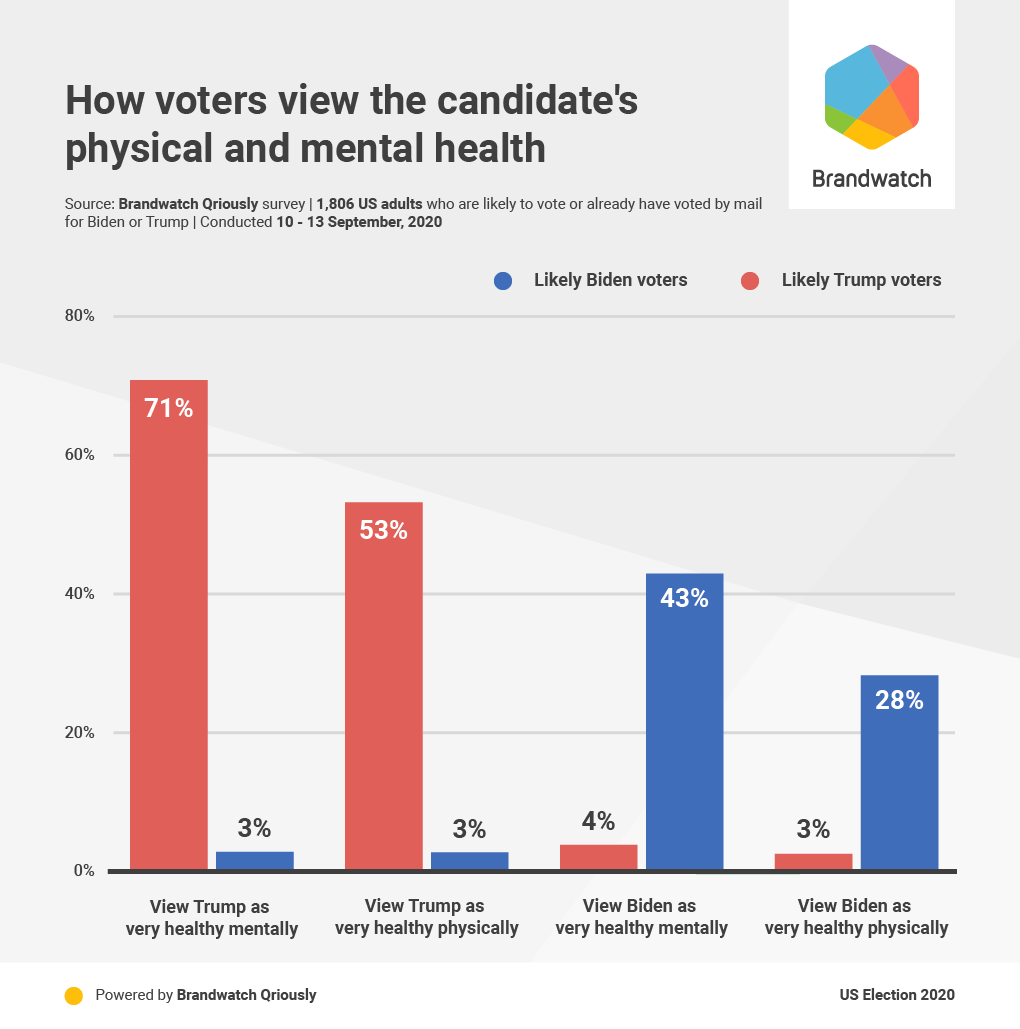
Unsurprisingly, voters see their own candidate as healthier than their opponent. But Trump voters seem to have more confidence in him, with 71% seeing him as very healthy mentally and 53% saying he’s very healthy physically. For Biden, those numbers are just 43% and 28% respectively.

The first presidential debate is just two weeks away, and this will act as a proving ground for both candidates to demonstrate whether they have the mental acuity and physical stamina they need to run the country.

Keep your finger on the world’s pulse

Want data covering more than just the election? Every Monday and Friday we send out our Brandwatch Bulletin, giving you data and analysis on current events, consumer trends, and everything in between.

Sign up for the Brandwatch Bulletin here.

Thanks for reading

That’s it for this week. Want the latest polling data next Wednesday? Sign up here.

Stay safe,

Brandwatch React

Data and methodology

Detailed tables and raw data are published here. Data is released under the Open Data Commons Attribution License (ODC-By) v1.0

Brandwatch Qriously uses river sampling and delivers market research questions to respondents via ads on mobile device apps. The proportion of respondents recruited in a particular app is determined by the demographic of its users, which allows for the collection of representative samples. There are no incentives meaning participants are more likely to provide candid and accurate responses. Qriously has successfully predicted nine major elections. It offers an accurate, fast, and reliable way to conduct market research, even within hard-to-reach groups and countries.

About the poll: 3,391 adults aged 18+ nationwide were surveyed from 10 September – 13 September, 2020. The size of the subsample of likely voters was 2,065. Data was weighted to be nationally representative in terms of age, gender, education, race, geographical region (census division), and NCHS urban/rural community type, using data from the Census Bureau’s American Community Survey. The margin of error at the 95% confidence level, taking into account the effect of weighting, is +/- 2.1 percentage points for estimates from the full sample. For the subsample of likely voters it is +/- 2.5 percentage points. Sampling error can be larger for subsets of these samples. In addition to sampling error, all polls are subject to a range of other potential sources of error. When percentages do not sum to 100% this is due to the effect of rounding.

logo
Digital Consumer Intelligence

Runtime Collective Limited (trading as Brandwatch). English company number 3898053.
New York | Brighton | London | Berlin | Stuttgart | Singapore | Sydney | Paris.

Update subscription preferences

Unsubscribe

We value your privacy

We use cookies to improve your experience and give you personalized content. Do you agree to our cookie policy?

No, take me to settings
Yes, I agree
More info.

By using our site you agree to our use of cookies —