US Election Bulletin 10/07: Latest Poll and Tax Tribulations

It's been a very, very busy week.

Welcome to our sixth election bulletin as we find ourselves just 27 days away from election day. This week’s survey ran as Trump announced he had contracted Covid-19, with 71% of our responses coming after the news broke.

The full fallout from this is yet to be seen, but a whole new side to this election has now come to the fore. Whatever the case, we’ll be there each step of the way.

Don’t miss next week’s poll by clicking the button below.

SUBSCRIBE

The results: Joe Biden: 49%, Donald Trump: 37%, undecided: 10%

Using Brandwatch Qriously, we surveyed 3,136 American adults from October 1 to October 4 2020. The above results come from the 2,048 respondents who say they are likely to vote or have already voted by mail in November’s election. (After weighting, this is 54.4% of the overall sample).

Biden leads with 49% of respondents supporting him, against Trump’s 37%, a margin of +12. A further 10% of likely voters say they’re undecided, meaning there are still many Americans yet to back a candidate.

As we do every week, we’re releasing our polling data along with our bulletin. If you want to have a dig around or do your own analysis, you can find our tables and the raw data here.

The undecided lean towards Biden

With 10% of likely voters still undecided, Biden’s current lead is far from secure. To see which way this group might be leaning, we asked them “If you had to choose a candidate today, who would you vote for?”

This week we found 21% are favoring Biden, and 10% are leaning towards Trump. If we included the answers to this question in our headlines figures Biden would have an overall vote share of 51%, Trump would be on 38%, while 4% would opt for a third party candidate or “None of the above”, leaving 6% still undecided.

How different workers plan to vote

This week we wanted to look at how the candidates’ support differs by occupation. To find out, we asked our respondents to tell us what sector they worked in, and then segmented our data along those lines.

Of the sectors shown, Trump leads in only two: industrial and “All other workers” (this includes respondents who chose “Other” or an answer with fewer than 100 likely voter respondents).

Trump’s 28 point lead amongst industrial voters is the biggest in any group. While a strong showing, it supports the idea that Trump’s route to victory hinges on keeping them on side and getting them to the ballot box.

In comparison, our data suggests that Biden is favoured by workers across the other four categories shown: office workers or other professionals, healthcare, services, and sales or retail. This indicates that he may have broader support across society.

At first glance that seems like a good thing, but it may make mobilizing voters, with disparate issues and concerns, more difficult. Biden must inspire a more diverse group of people and address the unprecedented range of problems and that’s no easy task.

Biden could push messages around Covid-19, an issue that’s been inescapable for all. To take a closer look, we also asked our respondents about their income in relation to the pandemic.

While a significant amount of workers from all sectors have seen their household income fall, this has been especially acute for the services and industrial sectors. While Biden looks well-placed with service workers, falling income and Covid-19 could be an area of focus to improve his numbers where they are weakest, with industrial workers.

Trump’s federal taxes

On September 27, The New York Times revealed an extensive investigation which claimed Trump had paid just $1500 in federal income tax across 2016 and 2017. On top of that, they reported that Trump is struggling financially and in a lot of debt.

The story kick started a huge online discussion of the topic. From Sep 27 – 30, our Consumer Research platform found 725k users and news articles mentioning Trump’s tax returns, with 62% of these posts being negative. The original New York Times piece saw 5.5m social shares and engagements alone, according to BuzzSumo.

Trump’s taxes have been a matter of speculation for years, particularly as he is the first president since Gerald Ford to not release their tax returns. While there is no legal requirement to do so, Trump has bucked a 46-year precedent.

But what do voters think of the issue?

Our survey found that 63% of likely voters see a presidential candidate releasing their tax returns as important or very important. In comparison, 22% said it was not very important or not important.

It’s pretty clear cut which way voters are leaning as a whole, but here’s how it splits out by voting intention.

An overwhelming 94% of Biden voters think the issue is important, while 45% of undecided voters think the same. Even 28% of likely Trump voters agree, suggesting there is some consensus on the issue.

With this in mind, will The New York Times investigation hold much sway?

While over a quarter of voters aren’t sure about the report, 40% believe that Trump paid only $1500 across 2016 and 2017; as reported by The New York Times. Meanwhile 14% believe he paid millions in federal tax during this period, a claim Trump made several times during the first presidential debate.

This changes drastically when we split out by voting preference. A third of likely Trump voters believe he paid millions, while just 2% of Biden voters believe the same. Meanwhile two thirds of likely Biden voters think Trump only paid $750 a year in 2016 and 2017, with 12% of likely Trump voters coming to the same conclusion.

Undecided likely voters were less likely to pick a side. We found that 57% of them were unsure, while 19% chose “neither of the above”.

Debate data

With discussions ongoing about whether the next debate should take place, let’s take a look at the first one. Our survey found that it was widely watched.

Whether they’re likely to vote or not, the vast majority of Americans saw at least some of the debate. Only 26% of Americans, and 15% of likely voters, avoided footage completely.

We also found that likely voters were more likely to watch the whole debate than US adults as a whole.

But will voters want to watch the second after the first was marred by bickering and crosstalk?

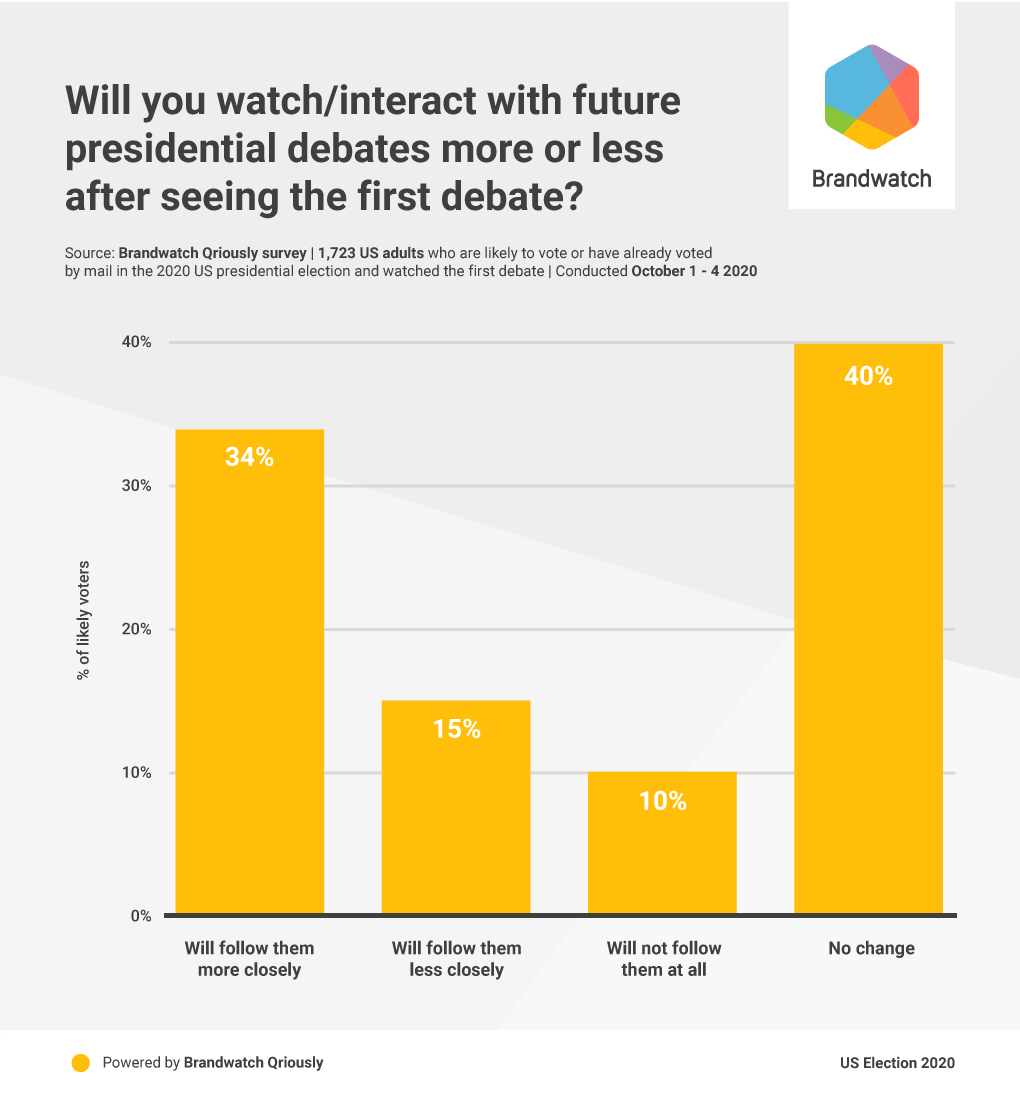
Nearly three quarters (74%) of likely voters who watched the first debate will either watch the same amount of the debates, or follow them more closely. With basically nobody turning off during the first debate, it’s clearly no easy task to shake off people’s interest.

If the next debates go ahead, they certainly won’t be short of viewers.

Keep your finger on the world’s pulse

Want data covering more than just the election?

Every Monday and Friday we send out our Brandwatch Bulletin, giving you data and analysis on current events, consumer trends, and everything in between.

Sign up for the Brandwatch Bulletin here.

Thanks for reading

That’s it for this week. Make sure to sign up for our bulletin to get our latest polling data next Wednesday.

Stay safe,

Brandwatch React

Data and methodology

Detailed tables and raw data are published here. Data is released under the Open Data Commons Attribution License (ODC-By) v1.0. If you are publishing or using this data you must give attribution to Brandwatch Qriously.

Brandwatch Qriously uses river sampling and delivers market research questions to respondents via ads on mobile device apps. The proportion of respondents recruited in a particular app is determined by the demographic of its users, which allows for the collection of representative samples. There are no incentives, meaning participants are more likely to provide candid and accurate responses. Qriously has successfully predicted nine major elections. It offers an accurate, fast, and reliable way to conduct market research, even within hard-to-reach groups and countries.

About the poll: 3,136 adults aged 18+ nationwide were surveyed from October 1 – October 4 2020. The size of the subsample of likely voters was 2,048. Data was weighted to be nationally representative in terms of age, gender, education, race, geographical region (census division), and NCHS urban/rural community type, using data from the Census Bureau’s American Community Survey (ACS), as well as 2016 Presidential election vote (or non-vote). Targets for 2016 vote were calculated using results from the Federal Election Commission, population totals from ACS and mortality data from the National Centre for Health Statistics. The margin of error at the 95% confidence level, taking into account the effect of weighting, is +/- 2.3 percentage points for estimates from the full sample. For the subsample of likely voters it is +/- 2.7 percentage points. Sampling error can be larger for subsets of these samples. In addition to sampling error, all polls are subject to a range of other potential sources of error. When percentages do not sum to 100% this is due to the effect of rounding.

logo
Digital Consumer Intelligence

Runtime Collective Limited (trading as Brandwatch). English company number 3898053.
New York | Boston | Brighton | London | Berlin | Stuttgart | Singapore | Sydney | Paris.

Update subscription preferences

Unsubscribe

We value your privacy

We use cookies to improve your experience and give you personalized content. Do you agree to our cookie policy?

No, take me to settings
Yes, I agree
More info.

By using our site you agree to our use of cookies —