US Election Bulletin 10/21: Latest Poll and Election Concerns

All data points to a disputed result.

Welcome to the 8th Brandwatch US Election bulletin. The election is just around the corner, there’s one debate left, and the early votes are pouring in. Who knows what might happen in the time left.

This week the bulletin brings you your regularly scheduled poll results, along with data and analysis on how Americans are feeling about the election itself. It’s not a particularly positive picture.

Make sure you don’t miss out on next week’s data by clicking the button below.

Get our weekly data

The results: Joe Biden: 50%, Donald Trump: 39%, undecided: 7%

Using Brandwatch Qriously, we surveyed 3,523 American adults from October 15 to October 19 2020. The above results come from the 2,371 respondents who say they are likely to vote or have already voted in November’s election. (After weighting, this is 54% of the overall sample).

Biden leads with 50% of respondents supporting him against Trump’s 39%, a margin of 11 points. A further 7% of likely voters say they’re undecided, meaning there are still many Americans yet to back a candidate, but this number is falling.

As we do every week, we’re releasing our polling data along with our bulletin. If you want to have a dig around or do your own analysis, you can find our tables and the raw data here.

Indecision continues to fade

With less than two weeks to go, the number of ‘undecideds’ among likely voters has fallen to 7%. Both time running out in the run up to election day and record levels of early voting (more on that later) are playing their part.

And while Biden’s lead outstrips the number of undecided voters, when states can be decided by the smallest of margins, we can’t ignore those who are yet to pick a side. To find out what way undecided voters are leaning, we asked them “If you had to choose a candidate today, who would you vote for?”

This week we found 11% are favoring Biden and 8% are leaning towards Trump. A further 7% picked third party candidates or none of the above, leaving 74% still very much undecided.

If we included the answers to this question in our headline figures, Biden would have an overall vote share of 51% and Trump would be on 39%. Meanwhile, 5% would opt for a third party candidate or “None of the above,” leaving 5% still undecided.

Not interested

Let’s take a closer look at our voters and non-voters alike. We asked our respondents how much they follow what’s going on in government and public affairs.

We found that 36% said “most of the time,” 30% said “some of the time,” 18% said “only now and then,” and 16% said “hardly at all.”

Now let’s look at how each of these groups is voting.

Biden has a clear lead among the most politically interested, and also appears well placed in the middle two groups. In our survey Trump came out (marginally) ahead only among those answering “hardly at all.”

Those who don’t follow politics are the least likely to vote, which makes sense. But this also highlights an opportunity for the candidates. If they can find a way to reach these people and to get them to vote, that could mean a lot for their chances.

Election concerns

Disinformation and voter fraud are concerns for any election, but they’ve grabbed a lot of attention this year. We gave our respondents a list of issues and asked them if they were concerned about any of them.

Whether they vote or not, we found the vast majority of American adults have concerns about the US election.

Fake news and disinformation lead the pack by a big margin. Nearly half of US adults (47%) see them as a concern. Fake news has been a huge issue for years, and it concerns people across the political spectrum.

Mentions of “fake news” on social media, forums, and blogs peaked in February 2017, according to our Brandwatch Consumer Research platform. Mentions generally fell continuously up until March 2020, where fake news around Covid-19 caused a spike.

Mentions went back down as the year wore on, only to spike again in September with the New York Times story on Trump’s federal taxes and the election itself being the main drivers behind the increase. October levels of fake news conversation, if the volume continues at its current rate, will look relatively high too.

These kinds of stories can chip away at a candidate’s support, and could easily turn a swaying voter. In an election that could come down to state-level razor-thin margins, fake news and misinformation can make a big difference.

Here’s how the same concerns manifest when split out by candidate choice.

For likely Trump voters, there were two big concerns: fake news (60%) and voter fraud (55%). Trump has focused heavily on both issues – the former throughout his presidency, and the latter throughout this year’s campaign. Clearly his message is getting through to his base.

While many likely Biden voters also cited fake news as a concern (42%), it came behind foreign interference (48%), and the losing candidate failing to concede (47%). Voter intimidation was also cited by 42% of Biden supporters.

All in all, it’s clear there is a lack of confidence in the election being conducted fairly before, during, and after people go to the polls, and that this feeling is shared across the board.

The done and dusted

With major concerns around voting, particularly mail-in voting, coinciding with high levels of mail-in and early in-person voting, we asked our respondents a few more questions on the topic.

We asked voters about their confidence in the security and effectiveness of mail-in ballots. Overall, 46% of voters told us they had “a lot” or “complete” confidence in mail-in ballots, versus 34% who said they had “no confidence” or “a little”.

As is so often the case, there’s a clear difference between likely Trump and likely Biden voters.

Again, this evidence suggests that Trump’s attempts to undermine confidence in mail-in voting are succeeding, but only with his supporters.

Meanwhile 15% of likely Biden voters aren’t too confident in mail-in voting either. That’s no insignificant amount, but it’s unlikely to be caused by Trump’s rhetoric.

Earlier this year, the US Postmaster General Louis DeJoy, appointed by Trump, planned major cuts for the country’s postal service. After a major backlash and accusations that this was an attempt to slow down and disrupt mail-in ballots, which often favor the Democrats, these cuts were ultimately suspended.

Nevertheless, this may have shaken the faith of likely Biden voters that their vote would make it from the post box to the ballot box.

Let’s move on to people’s thoughts about the election as a whole.

Despite a lack of confidence in mail-in votes amongst the majority of Trump voters, they’re pretty evenly split when it comes to seeing the election as being fair.

Roughly the same number of them believe the election will be fair and will trust the result as those that disagree or strongly disagree. Of course, 31% of them suggesting they won’t trust the result is still a huge chunk and this presents a worrying picture in the event of a Biden victory—especially if it’s a close win supported by mail-in voting.

There are a lot of people in the middle, and they’re coming from both camps. Again, this suggests a lack of confidence in the fairness of the election amongst a large portion of Americans.

Whoever comes out on top on election day, it’s increasingly likely that they’ll have to add an election challenge to their lists of problems.

Election challenge

We asked our respondents what they thought their favored candidate should do if they lost the election, and the responses suggest that a victor being named will not mark the end of the election. Rather, it’ll be the beginning of the end.

Of our likely voters, 41% want their candidate to challenge the election result if their candidate loses, while 24% aren’t sure. That’s a lot of potential support for a challenge – just 36% are confident that they’d want the result accepted, putting them firmly in the minority.

Here’s how things look when we break the data down by likely Trump and Biden voters.

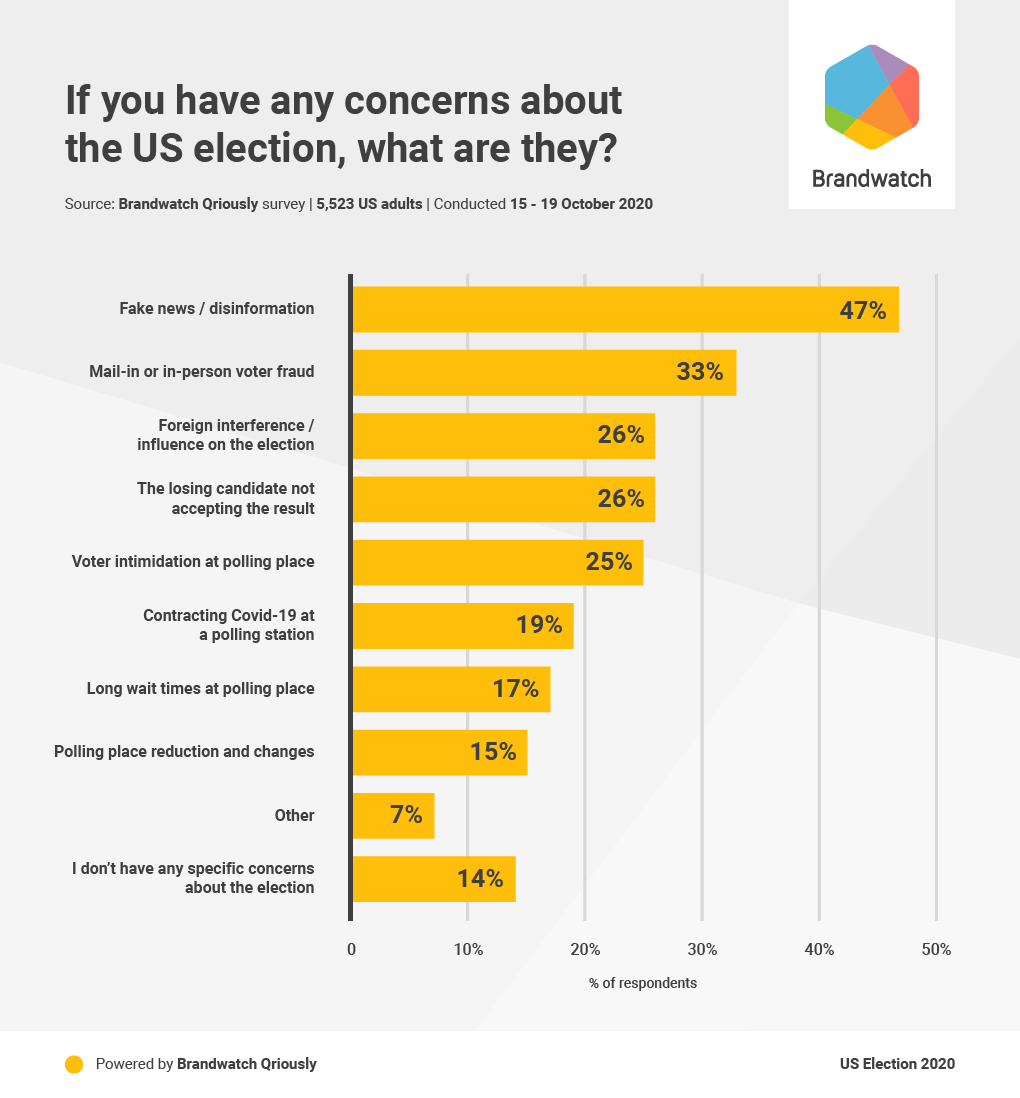
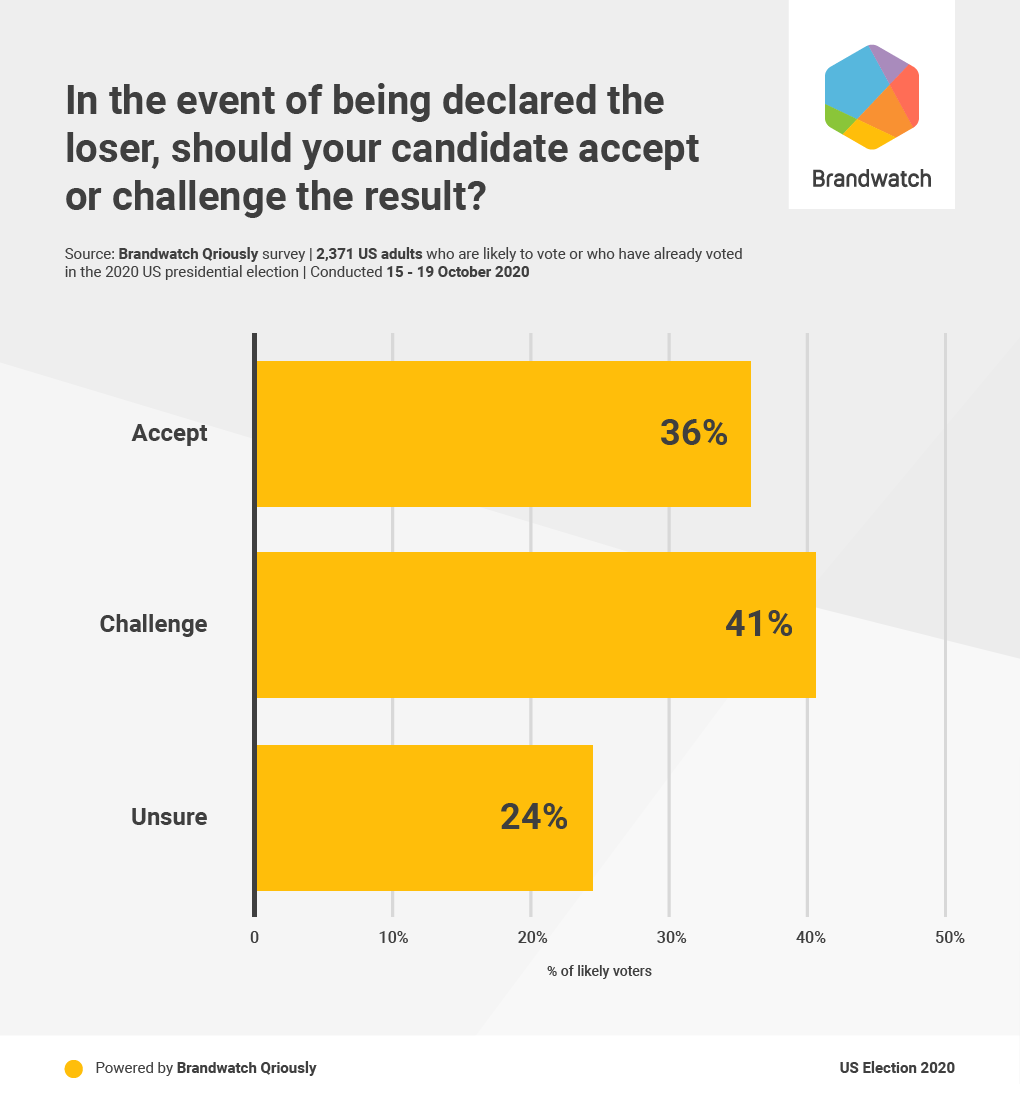
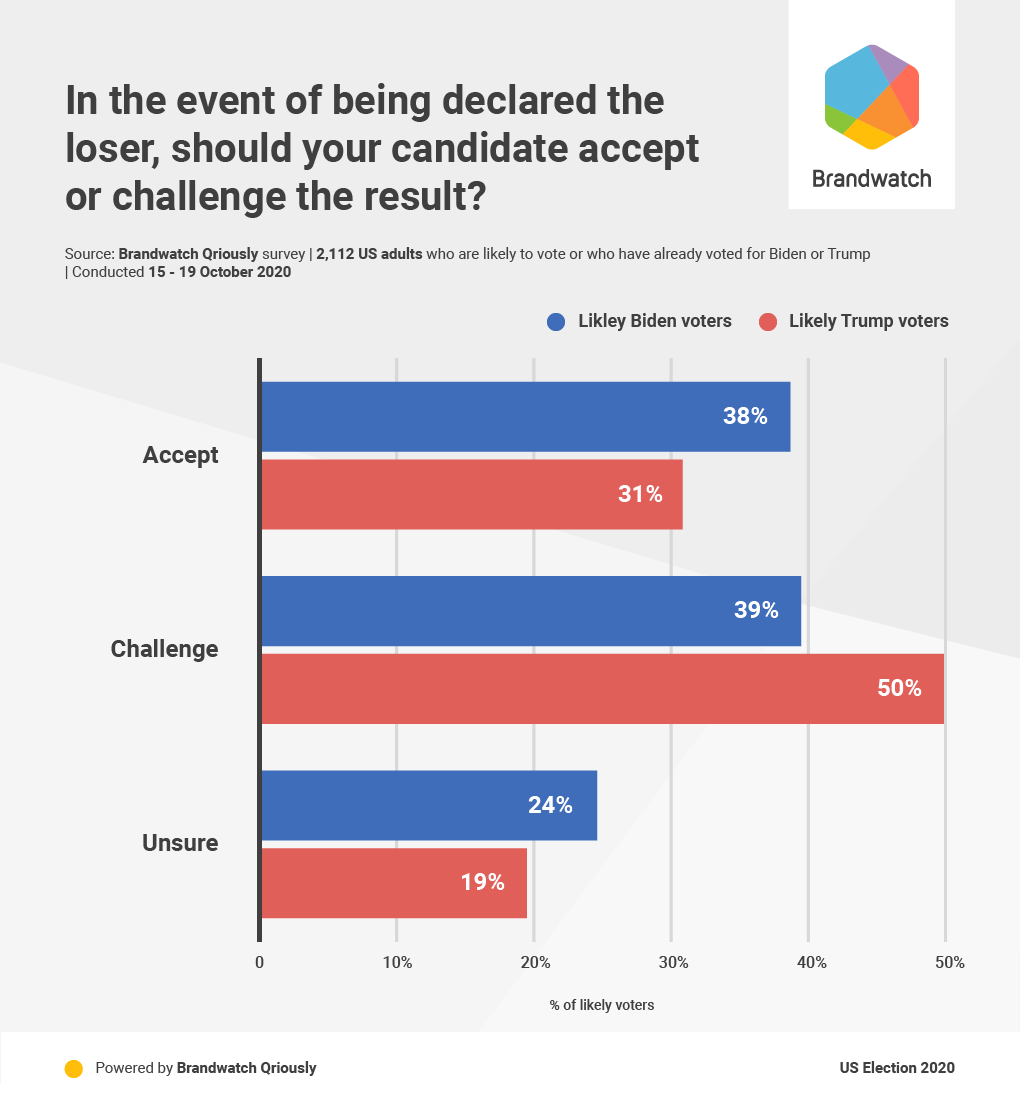
Trump supporters are more supportive of him challenging the result, which makes sense given his statements about the matter (although in his recent NBC Town Hall, he did suggest that he would respect the election’s outcome).

While the share of likely Biden supporters who would want him to challenge the result is smaller, this still stands at 39%.

Whatever happens, the post-election situation is likely to be rocky.

Keep your finger on the world’s pulse

Want data covering more than just the election?

Every Monday and Friday we send out our Brandwatch Bulletin, giving you data and analysis on current events, consumer trends, and everything in between.

Sign up for the Brandwatch Bulletin here.

Thanks for reading

That’s it for this week. Don’t forget to sign up for our bulletin to get our latest data next Wednesday.

Stay safe,

Brandwatch React

Data and methodology

Detailed tables and raw data are published here. Data is released under the Open Data Commons Attribution License (ODC-By) v1.0. If you are publishing or using this data you must give attribution to Brandwatch Qriously.

Brandwatch Qriously uses river sampling and delivers market research questions to respondents via ads on mobile device apps. The proportion of respondents recruited in a particular app is determined by the demographic of its users, which allows for the collection of representative samples. There are no incentives, meaning participants are more likely to provide candid and accurate responses. Qriously has successfully predicted nine major elections. It offers an accurate, fast, and reliable way to conduct market research, even within hard-to-reach groups and countries.

About the poll: 3,523 adults aged 18+ nationwide were surveyed from October 15 – October 19 2020. The size of the subsample of likely voters was 2,371. Data was weighted to be nationally representative in terms of age, gender, education, race, geographical region (census division), and NCHS urban/rural community type, using data from the Census Bureau’s American Community Survey (ACS), as well as 2016 Presidential election vote (or non-vote). Targets for 2016 vote were calculated using results from the Federal Election Commission, population totals from ACS and mortality data from the National Centre for Health Statistics. The margin of error at the 95% confidence level, taking into account the effect of weighting, is +/- 2.3 percentage points for estimates from the full sample. For the subsample of likely voters it is +/- 2.6 percentage points. Sampling error can be larger for subsets of these samples. In addition to sampling error, all polls are subject to a range of other potential sources of error. When percentages do not sum to 100% this is due to the effect of rounding.

logo
Digital Consumer Intelligence

Runtime Collective Limited (trading as Brandwatch). English company number 3898053.
New York | Boston | Brighton | London | Berlin | Stuttgart | Singapore | Sydney | Paris.

Update subscription preferences

Unsubscribe

We value your privacy

We use cookies to improve your experience and give you personalized content. Do you agree to our cookie policy?

No, take me to settings
Yes, I agree
More info.

By using our site you agree to our use of cookies —