US Election Bulletin 10/28: Latest Poll and Election Stress

Many Americans are feeling the pressure.

Welcome to our ninth US Election Bulletin, featuring our penultimate poll on who Americans want to be president.

In today’s bulletin we’ve got our latest polling data, and we’re looking at measures to improve elections, how popular the potential VPs are, and how much election stress the public has endured so far.

Make sure you click subscribe below to get our last polling data on Monday.

SUBSCRIBE

The results: Joe Biden: 49%, Donald Trump: 39%, undecided: 6%

Using Brandwatch Qriously, we surveyed 3,271 adults in America from October 22 to October 26 2020. The above results come from the 2,234 respondents who say they are likely to vote or have already voted in November’s election. (After weighting, this is 55.7% of the overall sample).

Biden leads with 49% of respondents supporting him against Trump’s 39%, a margin of 10 points. A further 6% of likely voters say they’re undecided. We also found, as of October 26, that 46% of likely voters have already cast their vote.

While Trump has narrowed the gap, Biden still holds a commanding lead at a national level. With huge numbers of people voting early, and less undecided voters to make up their minds, Trump has precious little time to turn things around.

We should note that despite Biden’s lead, other polls’ results suggest the race is much closer in swing states. While Trump is on track for a big defeat when it comes to the popular vote, that by no means guarantees that Biden will become president. More on this later.

As we do every week, we’re releasing our polling data along with our bulletin. If you want to have a dig around or do your own analysis, you can find our tables and the raw data here.

More minds made up

It’s the final stretch and, as you’d expect, people are making their final decisions on who to vote for. Our number of undecided voters totals just 6% of all likely voters, down from 10% a few weeks ago.

To find out which way the holdouts are leaning, we asked them “If you had to choose a candidate today, who would you vote for?”

This week we found 10% are favoring Biden and 8% are leaning towards Trump. A further 18% picked third party candidates or none of the above, leaving 63% still undecided.

If we included these answers in our headline figures, there would be no change to any candidates’ numbers, although “none of the above” would be at 4%, with 4% remaining “undecided.”

Election improvements

It’s been a fraught campaign in many ways, but issues around democracy and election integrity have been at the forefront. Could people be calling on this year’s winner to make changes to how US elections are run in the future?

We presented our respondents with a list of measures, and asked them if they thought they would improve the integrity of elections. Here’s what they told us.

While likely voters are more likely to agree the above measures will improve the integrity of elections, the order of preference is the same for all US adults (including unlikely voters) too.

Abolishing or reforming the Electoral College comes top. One driver of this is that a candidate can become president through Electoral College votes despite losing the popular vote—as happened in 2016. To some, these kinds of events make the system undemocratic. If this happens again this year, we can expect calls for reform to grow.

Support for that issue, along with all of the rest, is split down political lines.

Likely Biden voters favor Electoral College reform (54%), expanding early voting (43%), and expanding mail-in voting (43%). Likely Trump voters prefer new voter ID laws (44%), reducing or eliminating mail-in voting (36%), and reforming rules on campaign spending (26%).

It just so happens that the measures each group chose could be seen to benefit their preferred candidate’s party. Of course, this may be a coincidence…

Who is the MVVP?

It’s important to remember that no matter who wins, they’ll be the oldest president to be inaugurated in US history. The likelihood that a vice president will need to take the reins is statistically higher than in previous years.

With this in mind, we asked our respondents to rate the potential vice presidents on how good a job they’d do if they came to power.

Broadly, voters as a group rate each VP nearly equally. That said, the support falls heavily along partisan lines when you look closer. As you’d expect,Trump voters rate Pence highly while Biden voters rate Harris highly.

Interestingly, when comparing how people feel about the VP candidate on the ticket they are supporting, likely Trump voters tend to have stronger positive feelings about Pence than likely Biden voters have about Harris.

A greater share of Trump voters feel that Pence would do a “very good” job compared to Biden voters on Harris (68% against 55%), while Biden supporters are more likely to have a neutral view of Harris. This makes sense given that, as vice president for four years, Pence has been able to develop more of a profile. The data also suggests he could be a strong asset that could energize Trump’s base in this final week.

The obsession with polling

Polls attempt to give us some clarity in a sea of ambiguity, a glimpse at what’s going on before we know for sure. And while the veracity of polls is (and always will be) hotly debated, there’s no denying they attract the attention of political junkies as well as citizens with no special interest in the science behind them.

This year’s polls have grabbed a lot of attention, with 61% of likely voters saying they had followed them either a lot or a moderate amount. Just 13% have managed to avoid them all together.

We also looked at how this compares for likely voters of the two main candidates. A majority of likely Biden voters and likely Trump voters follow the polls, despite Trump’s continued use of the term “fake polls.”

The higher portion of Biden’s likely voters viewing polls and Trump’s negativity could be due to many polls giving Biden a healthy lead. But 2016 is likely fresh in the minds of many. They may be watching the polls to see how right they get it this year, and for any signs of a replay of four years ago when pollsters did well on predicting the popular vote, but failed to spot Trump’s swing state victories that put him in the Oval Office.

Either way, following the events of the election so closely might not be doing much good for stress levels.

Election stress

Stress has been a continuous feature of 2020 for obvious reasons. To find out how much the election is contributing to this, we asked respondents about their stress levels.

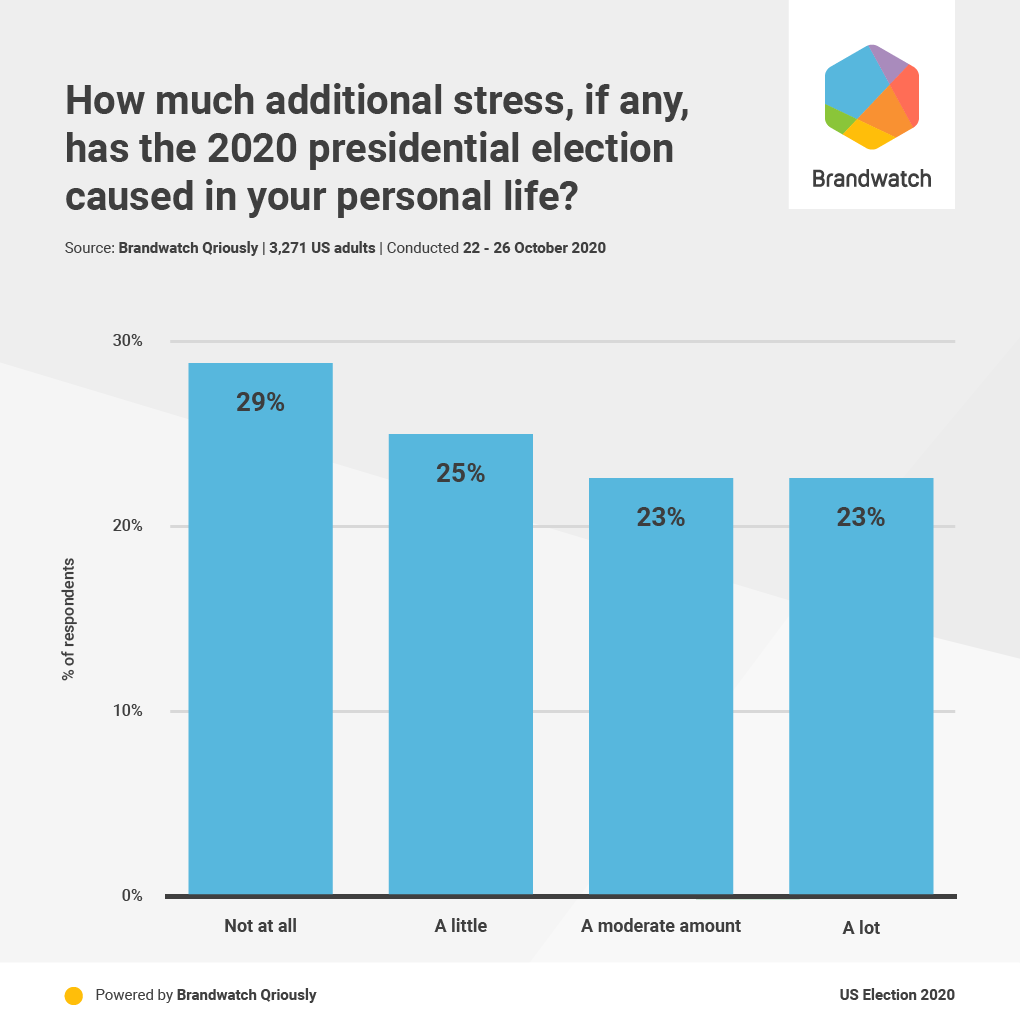
With 71% of US adults indicating that the election has brought at least some additional stress to their personal lives, it’s clear events are getting to them.

But there is some partisan divide here. We found that for 63% of likely Biden voters, the election had added ‘A lot’ or ‘A moderate amount’ of extra stress. Just 37% of likely Trump voters said the same.

This seems odd when Biden is leading in the polls, but touches on what we said earlier: that Biden voters are worried they’ll have the same experience as Clinton voters in 2016. Meanwhile, maybe Trump voters are confidently thinking the same.

If you’re one of the many people feeling the pressure or worried about what’s to come, here’s a piece from NPR on election stress and some ways to combat it.

Our final poll goes out on Monday

Due to the date of the election, we’ve got a slight change to our schedule. On Monday, keep an eye on your inbox for our final poll results.

We’ll then be back on November 11 with a post-election analysis to finish things off.

Keep your finger on the world’s pulse

Want data covering more than just the election?

Every Monday and Friday we send out our Brandwatch Bulletin, giving you data and analysis on current events, consumer trends, and everything in between.

Sign up for the Brandwatch Bulletin here.

Thanks for reading

That’s it for this week. We’ll be back on Monday with our final polling data. Get signed up so you don’t miss it.

Stay safe,

Brandwatch React

Data and methodology

Detailed tables and raw data are published here. Data is released under the Open Data Commons Attribution License (ODC-By) v1.0. If you are publishing or using this data you must give attribution to Brandwatch Qriously.

Brandwatch Qriously uses river sampling and delivers market research questions to respondents via ads on mobile device apps. The proportion of respondents recruited in a particular app is determined by the demographic of its users, which allows for the collection of representative samples. There are no incentives, meaning participants are more likely to provide candid and accurate responses. Qriously has successfully predicted nine major elections. It offers an accurate, fast, and reliable way to conduct market research, even within hard-to-reach groups and countries.

About the poll: 3,271 adults aged 18+ nationwide were surveyed from October 22 – October 26 2020. The size of the subsample of likely voters was 2,234. Data was weighted to be nationally representative in terms of age, gender, education, race, geographical region (census division), and NCHS urban/rural community type, using data from the Census Bureau’s American Community Survey (ACS), as well as 2016 Presidential election vote (or non-vote). Targets for 2016 vote were calculated using results from the Federal Election Commission, population totals from ACS and mortality data from the National Centre for Health Statistics. The margin of error at the 95% confidence level, taking into account the effect of weighting, is +/- 2.4 percentage points for estimates from the full sample. For the subsample of likely voters it is +/- 2.8 percentage points. Sampling error can be larger for subsets of these samples. In addition to sampling error, all polls are subject to a range of other potential sources of error. When percentages do not sum to 100% this is due to the effect of rounding.

logo
Digital Consumer Intelligence

Runtime Collective Limited (trading as Brandwatch). English company number 3898053.
New York | Boston | Brighton | London | Berlin | Stuttgart | Singapore | Sydney | Paris.

Update subscription preferences

Unsubscribe

We value your privacy

We use cookies to improve your experience and give you personalized content. Do you agree to our cookie policy?

No, take me to settings
Yes, I agree
More info.

By using our site you agree to our use of cookies —