REPORT
Emojis and Emotions
We looked at over 20bn data points to understand how we use emojis and emotional language to express ourselves online.
For this report, Brandwatch, BuzzSumo, and Falcon.io joined forces in exploring the world of emotion on the internet to help companies and their marketing teams make better decisions in communications.
Throughout the report, we examine the use of emojis, emotional language, and reactions using Brandwatch Consumer Research and BuzzSumo to uncover how both people and organizations express themselves online.
We’ll answer questions like:
- What’s the emotional state of the internet in 2021?
- How are consumers expressing their feelings around different sectors?
- What drives us to react in different ways to content on Facebook?
- What are the top-used emojis in 2021, and how do factors like gender and age affect their use?
- How do people feel about emoji inclusivity and representation?
And you’ll see pro tips from Falcon.io experts on how these insights can impact your work.
The emotional state of the internet
What can millions of online conversations tell us about how we collectively feel?
To answer this question, we used automated emotion segmentation in Brandwatch Consumer Research that analyzes and groups conversations by the emotions: joy, disgust, sadness, anger, fear, and surprise.
How did we feel in the first six months of 2021?
The chart below shows how use of emotional language has changed in the first six months of 2021 compared to the six months prior.
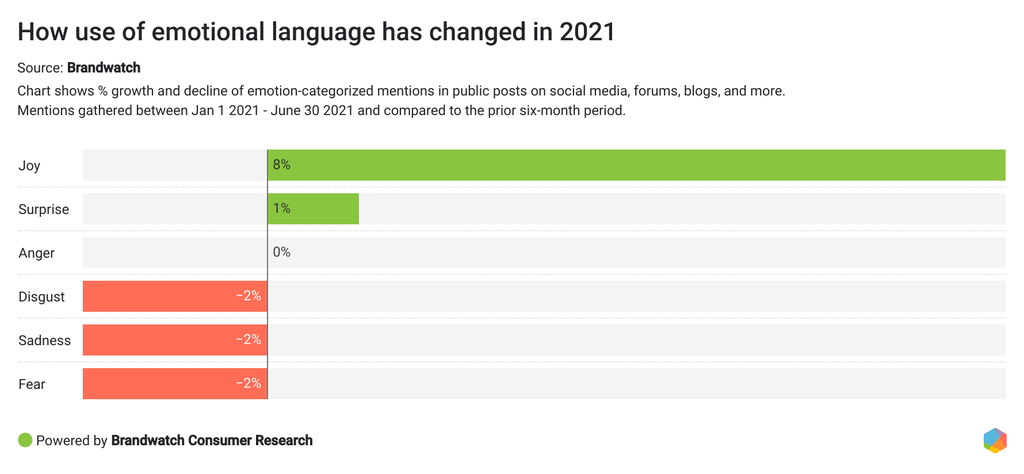
As we reviewed the data, joy turned out to be the most frequent emotion shared by users on social this year. Joy has also experienced the most growth in the last six months (+8% in mention volume when compared to the previous period).
The surprise emotion was the second runner-up in terms of change over time, with a 1% growth in mention volume when compared to the previous period of time.
The emotions of disgust, sadness, and fear, on the other hand, were down in comparison to the previous six months, which may suggest that the internet is beginning to feel calmer and happier.
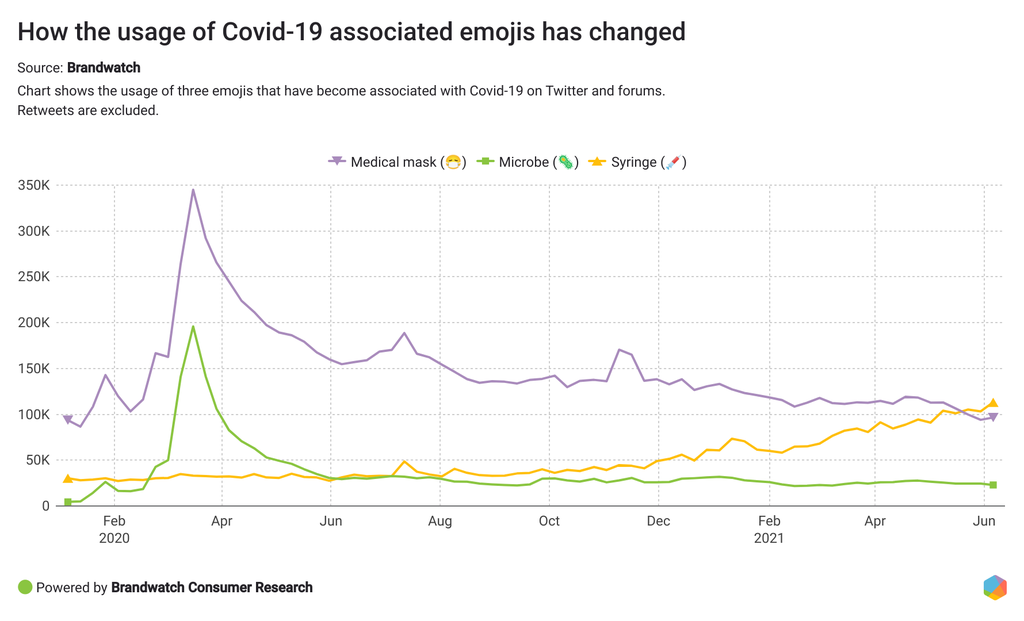
One reason for the uplift in mood might be better explained with emojis. We’ve found that pandemic-related emojis are telling a positive story of recovery with use of the syringe (or vaccine) emoji overtaking medical mask and microbe emojis.
The top emotions on social in 2020
We rolled back the date to 2020 to check what our emotional state was like last year.
Surprisingly, joy was the top emotion in 2020 as well. But what’s very different about 2020 is the volume of mentions growing for all six emotions (when compared to 2019).
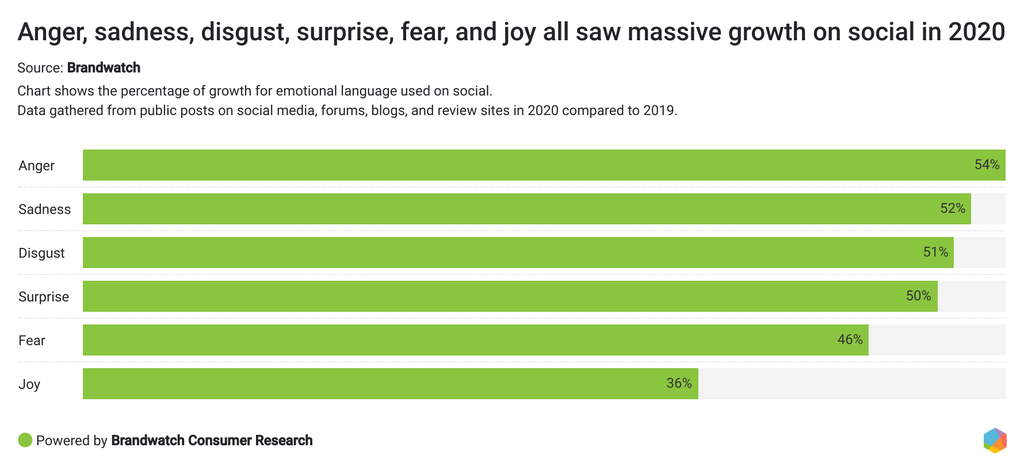
It’s pretty evident that our emotions went off the scale during the pandemic.
Emotional language and Facebook reactions across sectors
Examining emotions online allows us to keep a finger on the pulse of how consumers are feeling generally, but it also helps us understand public sentiment around specific topics, products, or sectors.
We selected five large market sectors and analyzed social data relating to top companies within each. The following chart shows how conversation about each sector differed in the first six months of 2021.
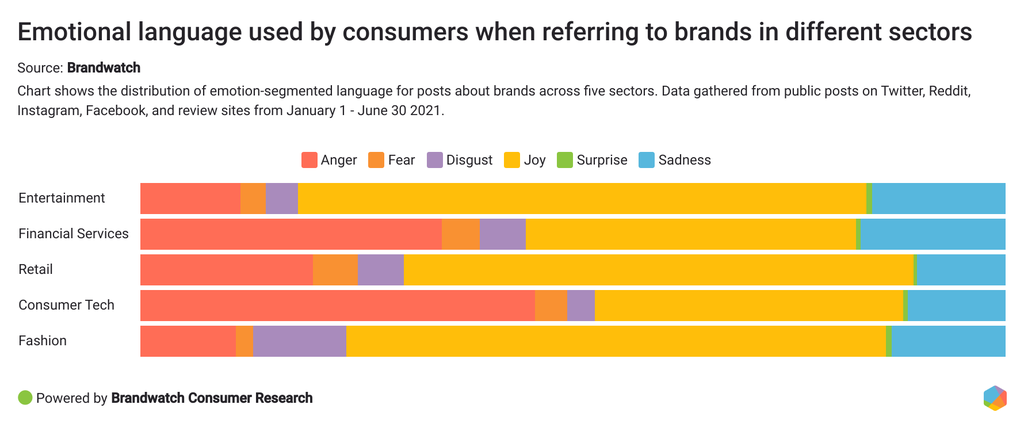
Entertainment and fashion had the highest percentage of joyful mentions out of our five sectors.
Our emotion analysis also revealed that:
- Consumer tech brands had the highest portion of angry mentions.
- Financial services brands had the highest portion of sad mentions.
Using BuzzSumo, we also examined Facebook reactions around content pertaining to the five sectors mentioned above.
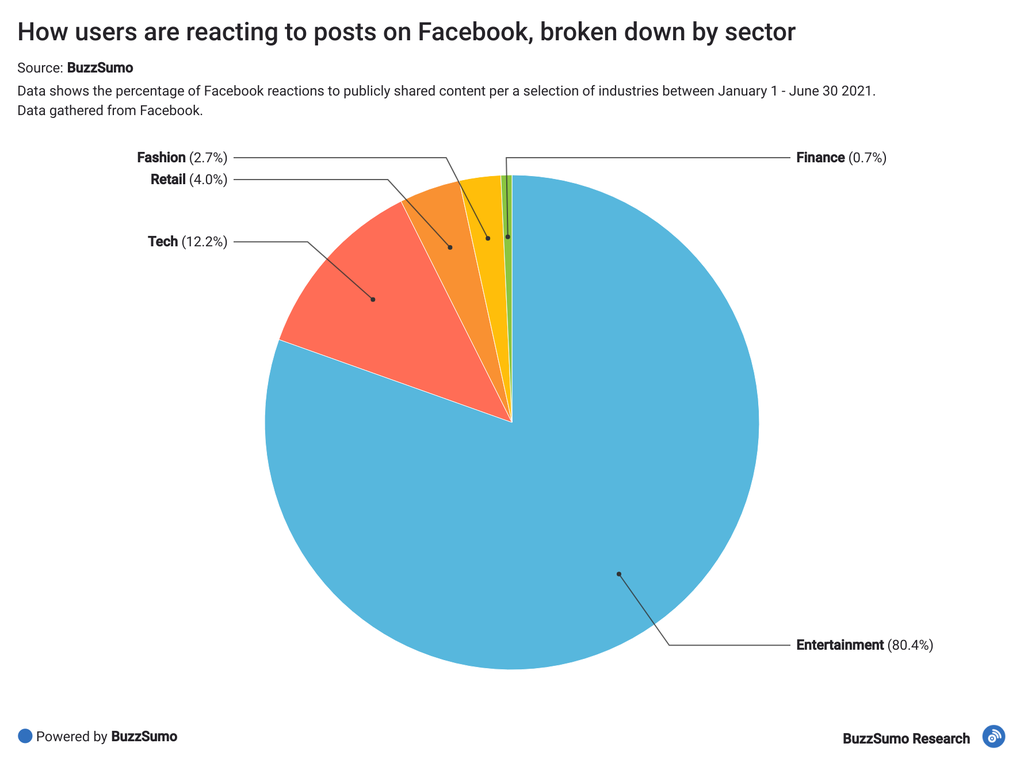
Perhaps unsurprisingly, Facebook users reacted to entertainment content far more than any other industry. Entertainment reactions accounted for 80% of all reactions to industry-focused content.
Facebook users were 7x more likely to react to entertainment content than to tech-based content. In fact, total reactions for entertainment content were 24x higher than the median average reactions of all other industry content.
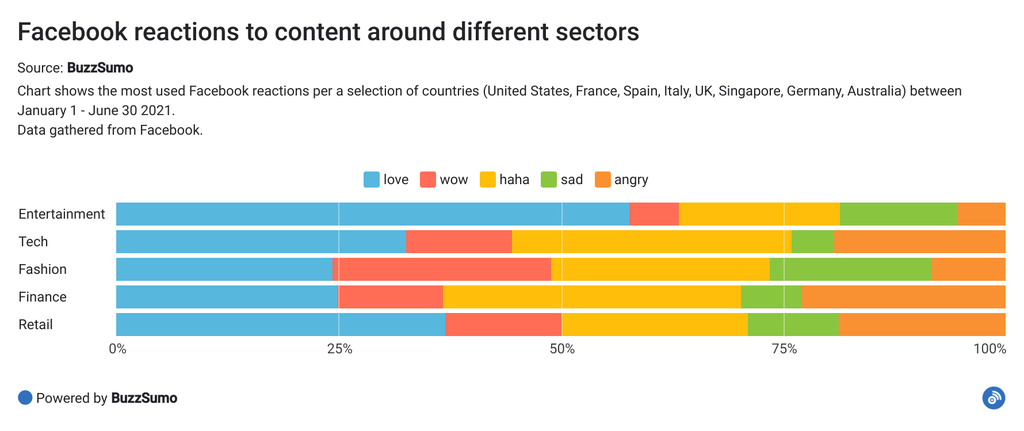
In terms of the breakdown of those reactions, entertainment content also saw a largely positive reaction, alongside fashion.
Tech and finance content garnered the most angry reactions compared to the other sectors, which corresponds quite neatly with the above data where the two sectors tend to attract a higher proportion of sad and angry mentions.
Facebook data: How are we using reactions?
In this section, we’ll dive deeper into Facebook reactions.
Facebook officially rolled out "Reactions" to users worldwide on February 24 2016. This long sought-after feature aims to give us more ways to express our feelings towards a post and brings a sense of emotional fluency to online chat.
For this report, we used BuzzSumo to analyze the Facebook reactions: love, haha, angry, wow, and sad.We examined 1.6bn Facebook reactions to 540 million posts within the first six months of 2021 (January - June). And we looked at a selection of countries from across the globe to see how their Facebook interactions differed.
Population, Facebook usage, and Facebook reactions
The US was 8x more reactive on Facebook than the next most reactive country – the UK. That said, while the US reacted most on Facebook, its spread of reactions was more balanced than other countries, with no one reaction standing out above others.
Is the US the most reactive country because it has a larger population, or does it have higher Facebook uptake? We looked into 2019 data from World Population Review on population and Facebook user statistics to find out.
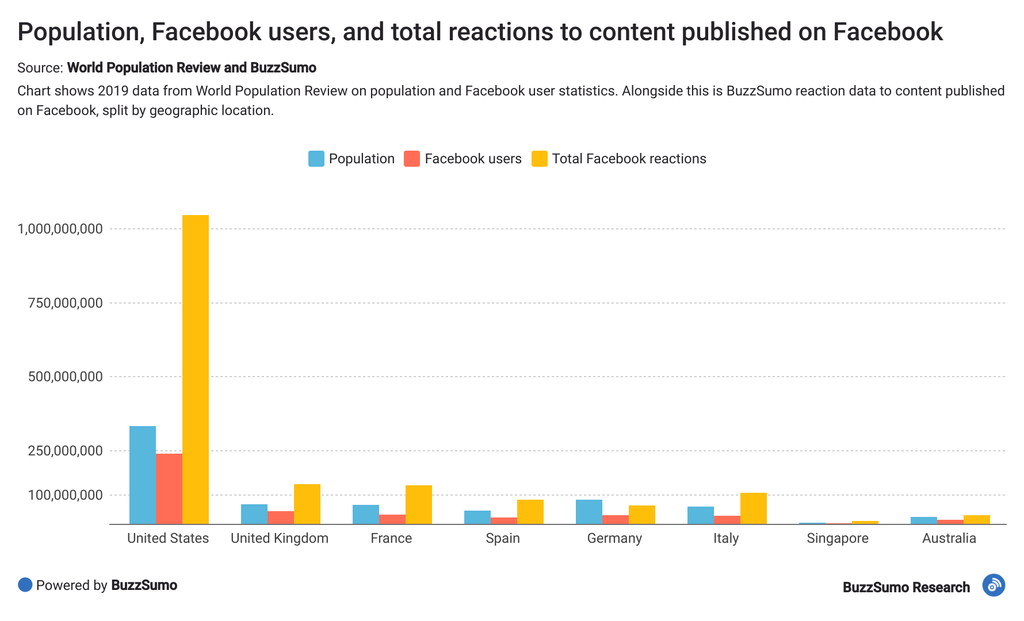
We found that:
- The US does have the highest population and Facebook usage of the countries studied, which explains the high number of reactions.
- Total Facebook reactions exceeded the population in every country we studied but Germany.
- Total Facebook reactions exceeded Facebook usage in every country we studied, meaning there was an average of at least one Facebook reaction per person using Facebook.
So just how many Facebook reactions per person did each country generate? And what about Facebook usage as a percentage of the population?
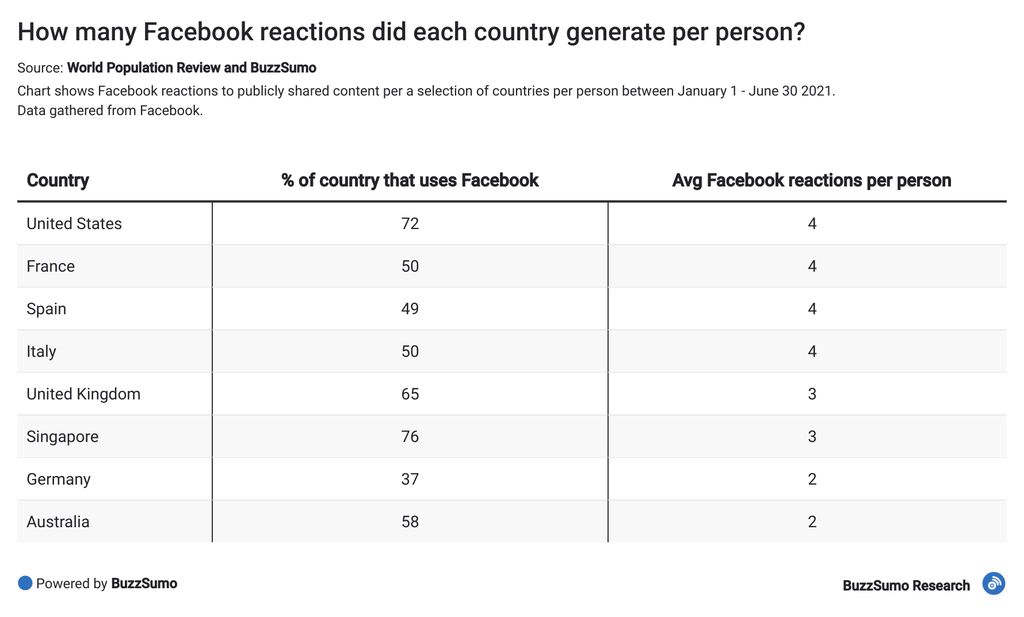
What’s interesting to note here is that Singapore actually has a higher % of Facebook usage than the US but, when it comes to average Facebook reactions per person, it's third lowest. Therefore, high Facebook usage doesn’t necessarily equal high reaction usage in a given country. Some countries have a clear preference of emoting to content via Facebook reactions.
Since all countries received Facebook reactions at the same time (2016), this is likely down to cultural differences. In fact, cultural differences, alongside a wide range of other factors, do have a significant impact on how we emote online. A recent study published in Frontiers explores this in great detail.
Positive vs negative reactions
Facebook reactions and emoji usage are nuanced, and this method of displaying emotion and/or opinion can be pretty ambiguous without the context of the content shared alongside it. A “joy” reaction, for example, could be a sarcastic response to a news story, while a “love” reaction could be used to display sympathy for the author of the content.
However, if we’re to generalize and assume that the “positive” reactions are indeed positive, and “negative” ones are negative, we can see the ways in which countries are more likely to emote.
“Positive” Facebook reactions include:
- love
- haha
- wow
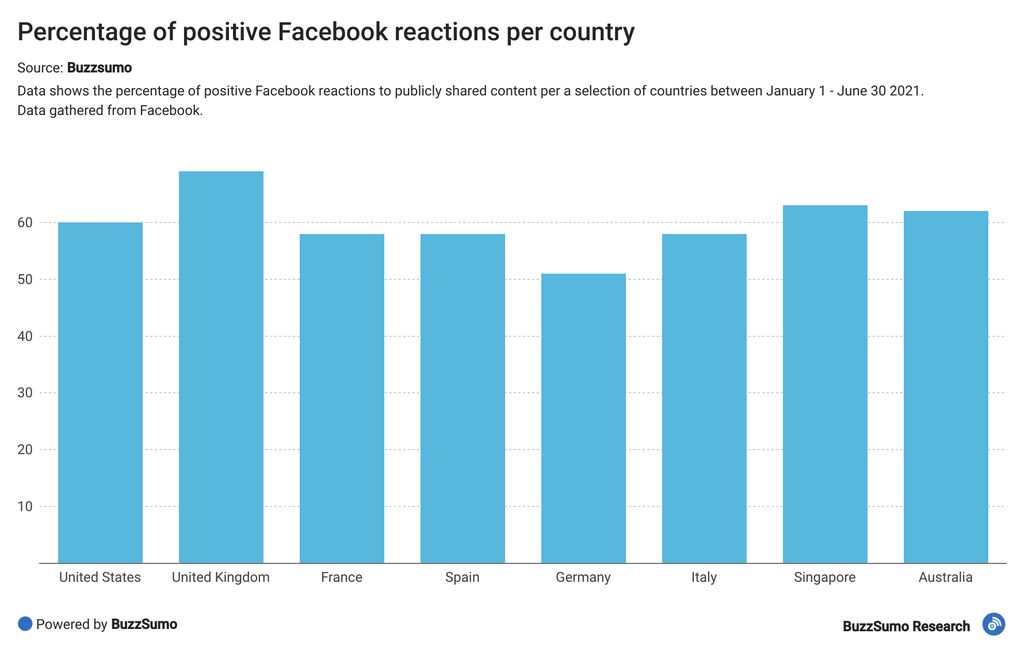
The UK was the most positive country when it came to Facebook reactions, followed by Singapore.
“Negative” Facebook reactions include:
- angry
- sad
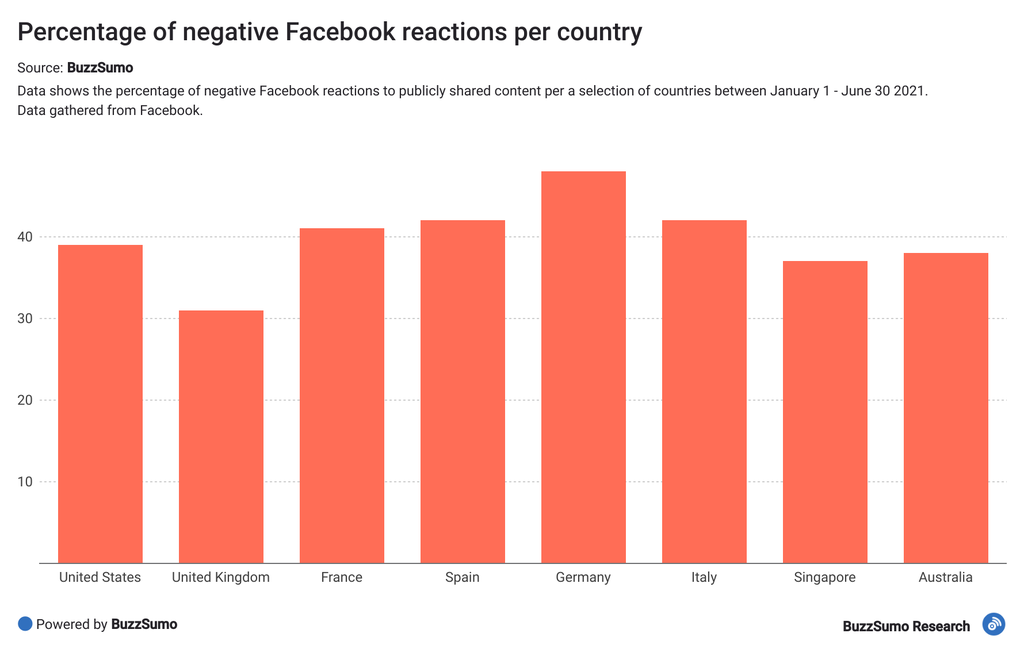
Germany was the most negative country when it came to Facebook reactions, followed by Spain, and Italy.
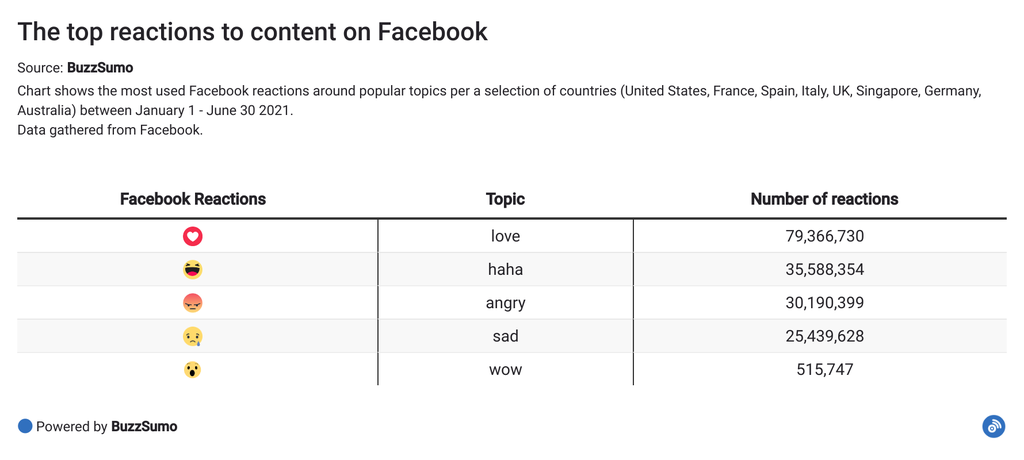
Facebook reactions by topic
We also looked into the breakdown of Facebook reactions by topic.
To choose the topics, we used Medium.com’s topic tagging system, and focused on tags that had 100+ articles associated with them over the course of a year. We analyzed 3,000 topics in total, and discovered the topics that generated the most reactions.
The top three topics by number of reactions were all “love” related:
- BTS
- Dog
- Baby
In fact, seven out of the top ten topics (by number of reactions) were love related.
K-pop band BTS’ global influence is huge. Earlier this year we published 10 Mind-Blowing BTS Facts and Statistics, and according to our research, between January 2013 and December 2020 there were 2,395,082,950 mentions of BTS (an average of 958,597 mentions daily). A quick search in BuzzSumo revealed that this year alone (Jan 1 - Jun 30 2021) there were 499,503 articles published, generating a total of 434,976,625 engagements. The most popular BTS post received a casual 28 million engagements on Facebook.
Positive vs negative topics
Generally speaking, the topics people engaged with on Facebook in the first half of 2021 were more likely to be positive than negative.
Adding up the total reactions for the top five topics in each category (“love”, “angry”, etc), we found that content that induced love or laughter gained the greatest number of reactions.
Things that spark the love reaction:
- birthdays
- photos
- songs
Things that make us say wow:
- drones
- physics
- artificial intelligence
Things that make us angry:
- students
- tax
- jobs
Things that make us laugh:
- memes
- bitcoin
- Elon Musk
Things that make us sad:
- plastic
- retirement
- pollution
How we use emojis online
We also looked at close to 20bn emojis shared in public social posts in the last six months to find out how they’re being used in conversations among consumers and different demographics, and by brands in public-facing communications.
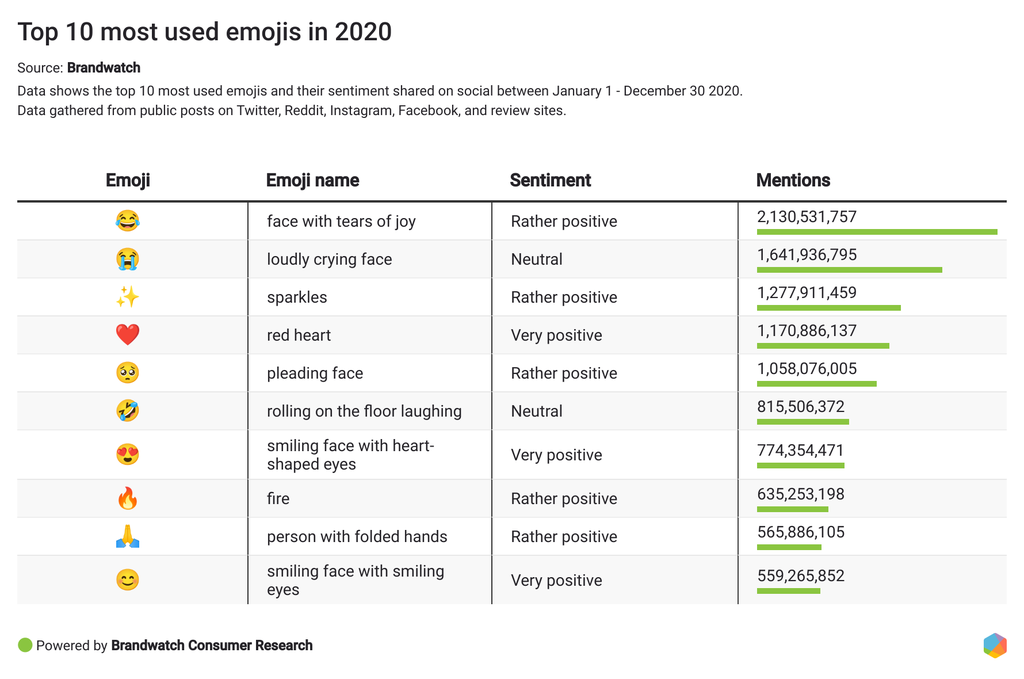
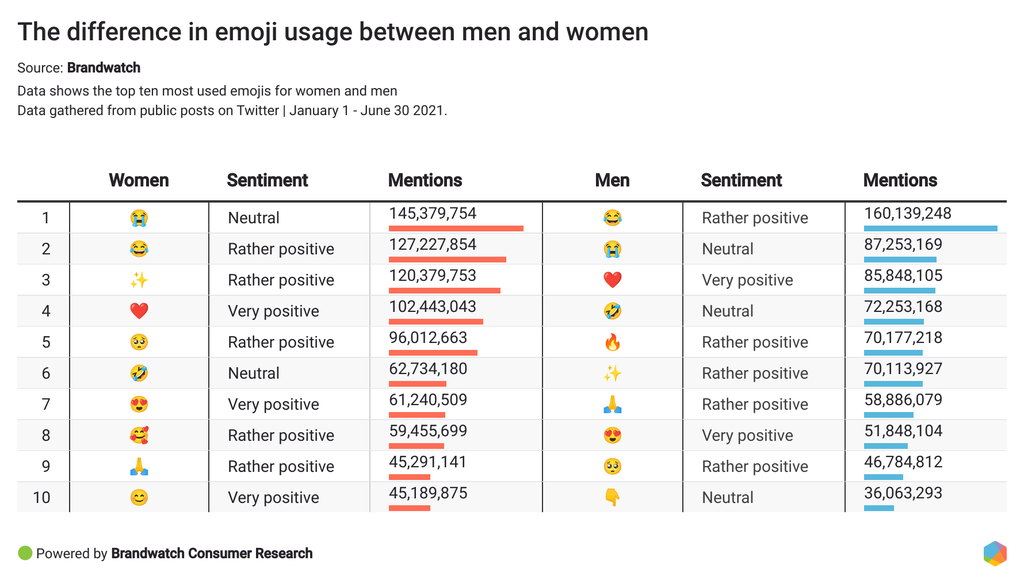
Here are the top 10 most-used emojis for the first half of 2021.
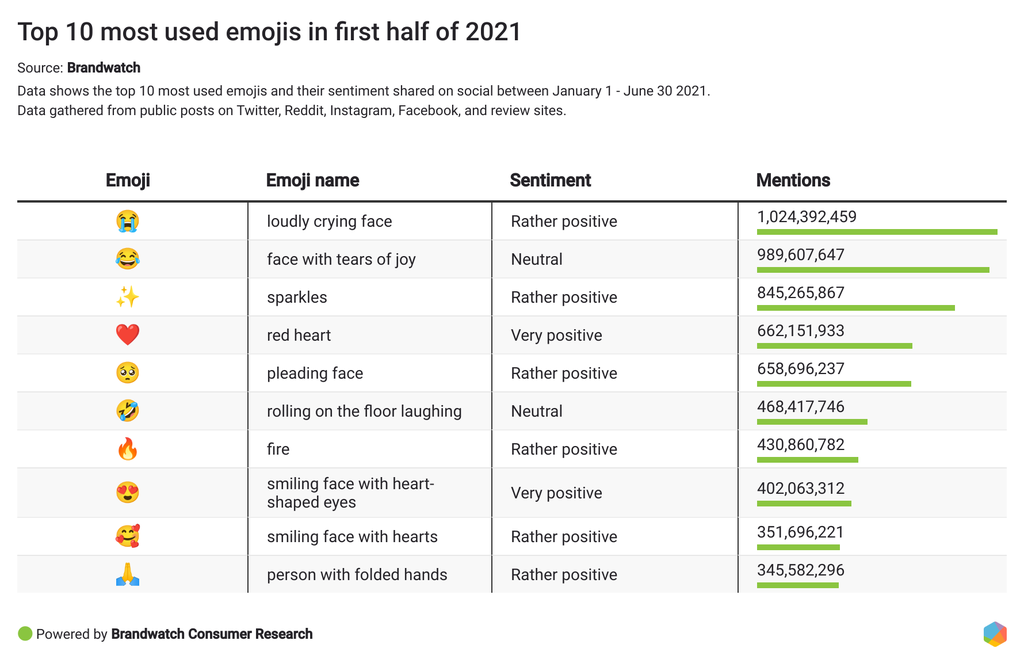
Eight out of the top 10 shared positive sentiment, with 😭 (the loudly crying face emoji) leading the list in 2021.
We compared the most used emojis in 2020 to the ones most used so far in 2021. Here’s what we noticed:
- The loudly crying face emoji was the second most shared emoji in 2020, and the face with tears of joy was #1 (more on this later!)
- ✨, ❤️, 🥺, and 🤣 have remained as #3, #4, #5, and #6 respectively for two years straight.
- 🔥, 🥰, and 🙏 propelled forward in 2021, pushing 😊 off the top 10 list this time around.
How has the use of emojis changed in the last 12 months?
We analyzed the top 10 most used emojis over time to see if we could uncover hidden trends.
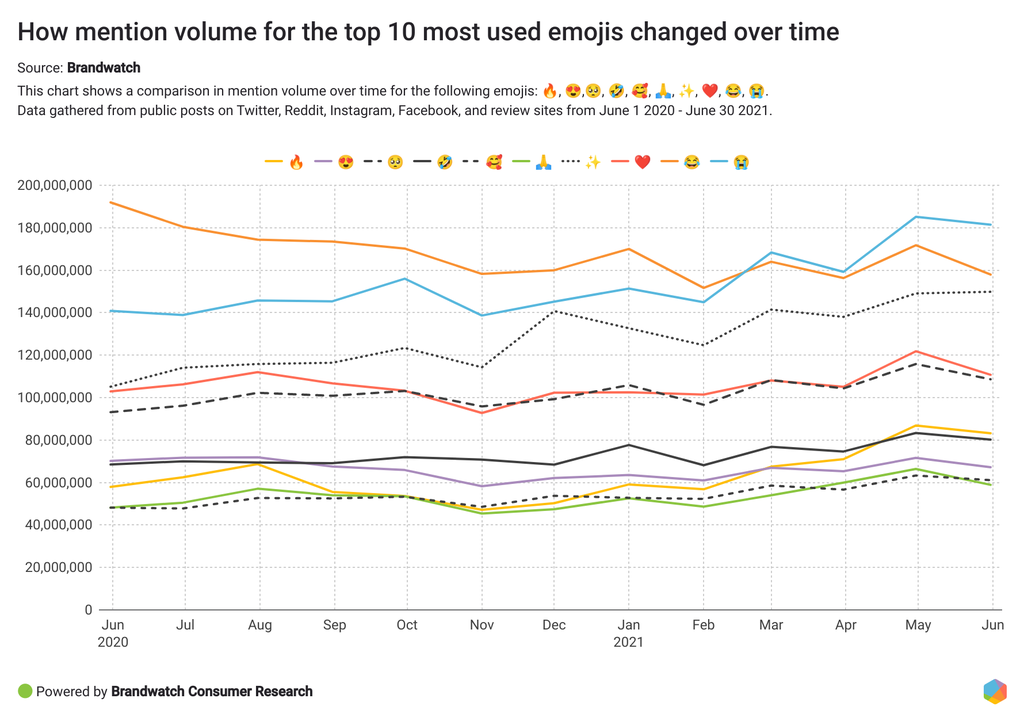
🔥 (fire), ✨ (sparkles), and 😭 (loudly crying face) emojis seem to be gaining popularity over time.
Both 🔥 and ✨ can be used to depict excitement and admiration. And 😭 emoji was defined by Emojipedia as an emoji that “conveys uncontrollable feelings and overwhelming sentiments, ranging from grief and disappointment to hilarity and joy.” Essentially, 😭 is used to exaggerate sentiment in conversations, and it’s frequently paired with one of the “excitement” emojis.
What triggered spikes in mentions of these three emojis in the last six months?
- 🔥 was heavily used in conversations about K-pop, especially those mentioning popular bands like NCT Dream and BTS, as well as the iHeartRadio Awards.
- 😭 received close to 250k mentions in conversations that shared #bts_butter, a branded hashtag that promotes a new song by BTS.
- ✨ seemed to be very popular among the Japanese speaking users on Twitter, and it was used in conversations ranging from promoting movie releases and games to a contest by one of the largest consumer electronics retailers in Japan.
As mentioned above, BTS’ influence in the world is truly incredible. Here are a few stats on BTS from our recent research:
- BTS’ “Butter” is at #18 on the The 20 Most-Liked Videos on YouTube list (at the time of writing).
- The band has a large fan base, often referred to as an army. If BTS fans were to form a real army, there would be enough people for at least 18 of them.
- In 2017, BTS were the reason for one in every 13 tourists’ visits to South Korea, bringing in over $3.6 billion a year to the country’s economy.
How do companies use emojis?
With the help of Brandwatch Consumer Research, we were able to examine verified Twitter accounts that belong to organizations and have a following of over 100k. This enabled us to get a look at how big organizations and businesses use emojis.
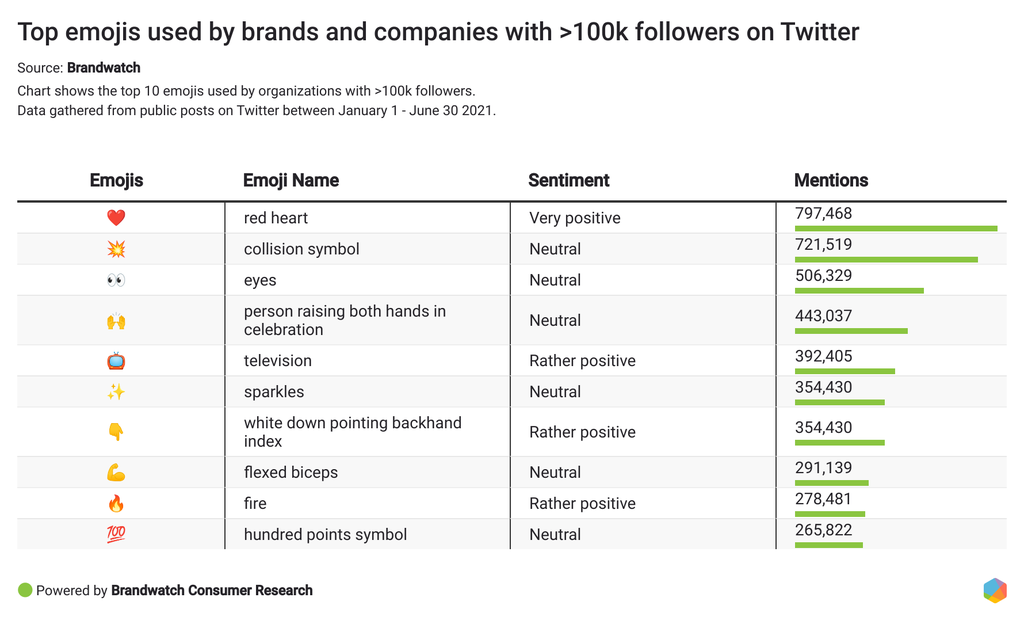
❤️ (red heart emoji): with 822k mentions, this emoji has topped the list as the most used emoji by brands and organizations so far this year. Coming in close behind were the 💥 (collision) and 👀 (eye) emojis.
We looked into these three emojis to see how they were used by business accounts.
❤️ is often used in conversations thanking fans for their support. For example:
💥 is often used to build anticipation. For example:
👀 is often used to fuel interest or to invite people to learn more. For example:
Since face-to-face communications have been very limited due to the pandemic, emojis as a form of non-verbal communication add a personal touch to conversations with consumers.
Which emojis do people use when talking about companies?
Let’s return to the five sectors we mentioned earlier. We also took a look at the top emojis used by consumers in conversations about brands within the selected sectors so far this year. Here’s what we found:
Entertainment:
- 💜 (purple heart) emoji was the top used emoji for brands in the entertainment industry. This mainly came from people celebrating BTS who are closely associated with this emoji.
- 🔥 (fire) came a close second. This is similar to what we see in fashion brand mentions.
Financial Services:
- 🔗 (link) emoji was the top used in the financial services industry conversations. This was driven by a tweet from band SuperM about a collaboration campaign they’re doing with Prudential, all about keeping fit.
- 🙏 (folded hands) emoji was next top for financial services brand conversation. Many mentions here were actually asking people for money for various causes. We found many accounts sharing their payment/fundraising information in a bid to raise money on social media.
Consumer tech:
- 📸 (camera) emoji is the top used in consumer tech conversations. This is driven by people snapping pictures on fancy cameras for Instagram and tagging the photography brand.
- 💜 (purple heart) is the second most used emoji in consumer tech conversation. The influence of BTS is felt in this sector too, driven by their tech brand collaborations.
Fashion:
- 🔥 (fire) is the top used emoji around fashion brands online. Sneakers were particularly popular in this conversation, particularly hype around Louis Vuitton x Nike Air Force 1s.
- ✨ (sparkles) was the second most used emoji around fashion brands, denoting shininess, newness, and fabulousness in general.
Retail:
- ✨ (sparkles) was the top used emoji around retail brands. Also popular in fashion, sparkles represent shiny new things to be purchased or that are desired online.
- ❤️ (red heart) is the next biggest emoji in retail brand conversations. Home goods were particularly popular in this conversation.
Does the internet have a “favorite” emoji?
We took a look at the top emojis appearing in mentions that included phrases like “my favorite emoji” or people expressing their like or love for an emoji.
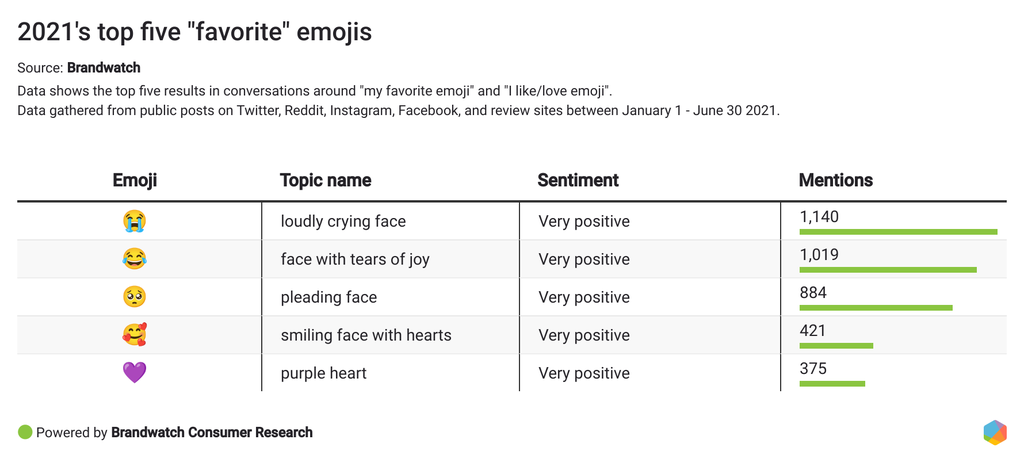
😭 – the loudly crying face emoji – has topped both the most frequently used and the list of emojis people say they like best so far this year. But it would be wrong to say that use of this emoji is uniform across different groups of people. In the section below you’ll find out how different generations use emojis in slightly different ways.
Gender, generations, and emoji use
Using gender segmentation in Brandwatch Consumer Research, we found the split of the authors within our gender analysis that mentioned emojis in conversations in the first half of 2021 was around 51.5% to 48.5% for women and men respectively.
There do appear to be some key differences between how men and women use emojis, outlined below:
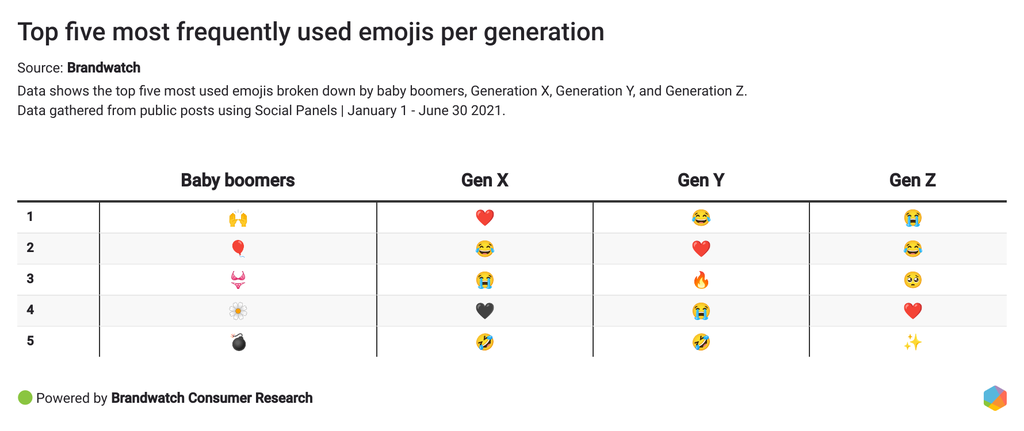
We also used prebuilt Social Panels in Brandwatch Consumer Research to learn about the use of emojis among different generations in the last six months.
Unsurprisingly, Gen Z are huge fans of emojis. In fact, the volume of mentions including emojis shared by the Gen Zers we studied reached 5.33 million in a single week at its all-time-high this year (week beginning January 4 2021).
Emojis and representation
If you ever wondered how many emojis there are, the count varies depending on the source from 3,353 (Webnots) to 3,521 (Emojipedia).
New emojis are being added fairly regularly. In June 2021, Statista reported that 334 new emojis were released last year as part of the Unicode Emoji 13.0 and 13.1 updates. And when we looked into the conversations including “new emoji” back to January 2020, we were able to find the new and upcoming releases sparking the most interest.
For example, earlier this year, Google’s Diversity and Inclusion team reported that the multi-skin tone handshake emoji is to be released in 2022.
Many of the newly released emojis feature more inclusive designs. For example, on January 29 2020, Emojipedia reported a new emoji release for the transgender flag. The tweet was retweeted close to 9k times and liked by over 35k people.
Of all the new emojis released in 2020, the trans flag has gained a lot of popularity, getting the second-most engagement of all emojis announced by Emojipedia.
Brands, too, have contributed to this by using the new emoji in their posts around the International Transgender Day of Visibility. Ulta Beauty's post celebrating this day and featuring the trans flag emoji was one of their top posts between January and June 2021.
Another popular release included the long-awaited Italian hand gesture emoji, and Twitter users were all about it:
The last tweet above is a perfect segue into our research on emojis and representation. How do people feel about representation within emojis?
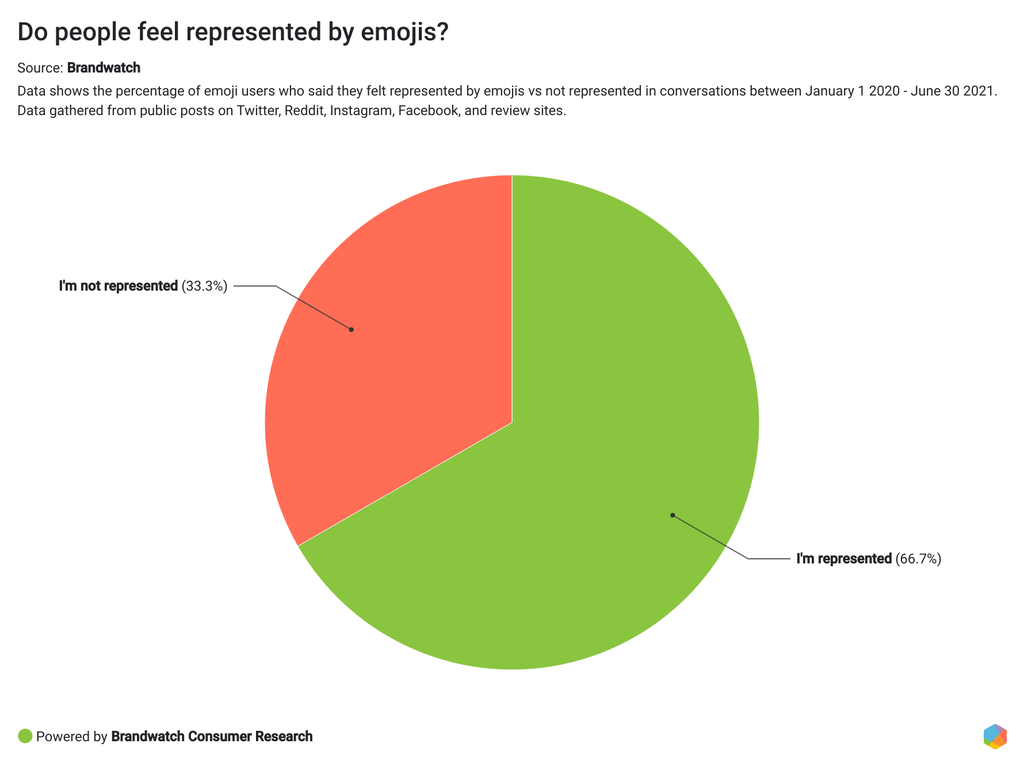
While the sample size of emoji users who shared their feelings on being represented (or not) through emojis in the last 12 months was small, more people reported that they felt “represented” by the existing emojis than those who didn’t.
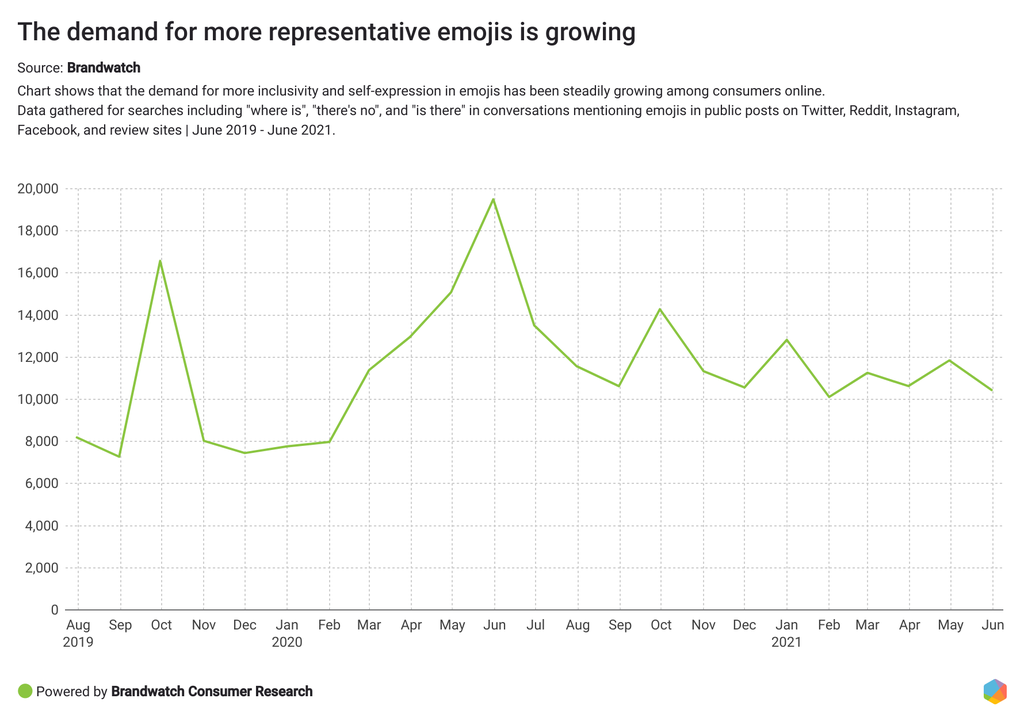
While many are claiming they feel represented, we also looked into the last two years of data and found the demand for more representation and self-expression in emojis has been increasingly growing among consumers online.
According to this Print Magazine article, currently, the process for accepting new emoji ideas is based on voting done by 12 members who pay $18,000 a year for the rights to vote. Nine of the voting members come from global tech companies like Oracle, Microsoft, Adobe, and Apple, and the voting member group is said to be mostly white and male.
There are a number of campaigns and groups fighting to make emojis more inclusive. For example, Emojination has made it their mission to "make emoji approval an inclusive, representative process”. Emojination has been actively fighting for equal representation in emojis, advocating for emojis like: 🥟, 🥡, 🥢, 🥠, 🧕, 🧻, and 🧬.
But there are still many emojis missing.
Many consumers reported emojis they’d like to see that have yet to be created (some are more serious than others):
Summary and learnings from Falcon.io 💡
This analysis makes it apparent that emojis are still as relevant as ever, and the last reluctant marketers need to get on the bandwagon. New emojis such as the trans flag, bubble tea, and pleading face have all been received positively by users. Emojis are always going to be used to express emotions when mere text doesn’t suffice.
It wouldn’t be a long shot to posit that emojis are an excellent way to measure brand sentiment on social media to a certain degree of accuracy. Emotions drive your audience’s purchasing decisions, so the ability to gauge sentiment from emojis and emotional language is a big plus for every marketer.
This report also brings to light a pandemic-induced trend. The rapid digitalization the pandemic brought on shows no sign of abating even as restrictions ease in some countries. The major shift in shopping, media consumption, entertainment preferences, and more might stick around for a bit. Marketers need to be mindful of this shift and pivot their messaging accordingly.
Context is also an important takeaway from this report when it comes to emojis and emotions. Not all emojis mean the same globally or across different generations. Global brands with a multi-generational demographic would do well to be aware of the various connotations emojis carry across audience segments.
In all, monitoring emojis and emotions in real time is extremely important to measure brand sentiment, compare against the dominant emotions in your industry and country, and understand how your audience perceives your brand. With all this data by your side, coming up with an emoji marketing strategy should be as easy as can be!