GUIDE
Bringing Together Structured and Unstructured Data
Here’s why and how analysts should take advantage of the benefits of both types of data
We are surrounded by data. Managing it all in useful ways seems to be a defining challenge of our time.
Lots of data sources have been mastered, with many of us well versed in the tools that sort and extract insights from them. Meanwhile, there are large swathes of data – data that takes a little more processing – that’s often missing from the table when big decisions are made.
The key to a more rounded picture is to bring together both structured and unstructured data in order to extract the insights that matter from both.
In this guide, you’ll learn:
Structured and unstructured: What’s the difference?
A tempting definition for these data types is ‘neat’ (for structured) and ‘messy’ (for unstructured). But we’ll go into a bit more detail.
Sources of structured data might be:
- The output of multiple choice questionnaires
- Sales data that’s been collected in a uniform way
- Customer contact information (if collected in a uniform way)
- Pre-existing datasets that are already formatted consistently
But not every data source fits into this category and, especially when humans are involved, many sources start out in a much messier form.
Sources that are likely to give you unstructured data might be:
- Social media posts
- Photographs
- Call logs from customer service conversations
- Open ended questionnaires
Note: Don’t get structured and unstructured data confused with structured and unstructured interviews. The latter refers to the way questions are asked, not the way the data output arrives.
At Brandwatch, our technology helps to make sense of unstructured data. We give thousands of our users the ability to bring structure and meaning to vast swathes of social data, from tweeted images through to lengthy forum posts. This involves natural language processing, machine learning, and cutting-edge image analysis – all excellent tools for bringing much-needed structure to unstructured data sources.
Example: Giving structure to unstructured data
Let’s give a quick example. Every year, when it gets hot and muggy, there’s a day when flying ants all come out in unison. This happens on different days depending on your locale, but the occurrence is colloquially known nationwide as Flying Ant Day.
I want to find out about how people are talking about Flying Ant Day, but without the right tools I’m looking at a mass of tweets – the only real structure is that they all contain #FlyingAntDay, and that I can order them using Twitter Search. Other than that, it’s a bit of a mish-mash of different bits of text and emojis, all mixed up together.

By searching for mentions of #FlyingAntDay in Brandwatch Analytics, I’m able to break down the data in different ways – by day, by location, or by gender. I can download that data into Excel for further manipulation, or I can build out my own ways of breaking things down in the platform (e.g. tagging up mentions that include the ant emoji).
A mess of data becomes something searchable and simple to manipulate – that’s what we’re talking about when we discuss bringing structure to unstructured data.
Why is it important to combine structured and unstructured data?
For time-short teams, there is a temptation to keep things simple. Datasets that require a lot of processing and don’t immediately fit neatly into easily analyzable forms aren’t exactly appealing when things need to be done quickly.
But omitting unstructured data can mean missing out on lots of insights.
Observational data vs prompted data
Many of the data sources that are unprompted (collected using means that don’t interrupt or influence the actions of the subject, like social listening) will produce unstructured data. Meanwhile, lots of the data sources that directly addresses the subject, like multiple choice survey questions, will produce structured data.
By omitting unstructured data from analysis, analysts are wiping out many sources of unprompted data. That means missing out on people reviewing your products online, how people discuss your competitors in forums, and the kinds of comments being made about your latest CSR initiative, to name just a few things. Unprompted data allows for analysts to observe subjects in their ‘natural habitat’, without researcher bias affecting the data input, and it’s an invaluable source of insights – just check out how our clients have used it.
Spotting patterns
By bringing all your data together in one place that provides structure to it, patterns can be spotted and relationships between different data points can be examined.
For example, by plotting negative tweets relating to a particular product against the timing of messages sent to customer query live chats or calls to customer services, a company might spot that customers are likely to complain first on social media and second by calling in – this gives them the chance to arrange for reinforcements either on the social team (to address incoming queries) or in the team taking the calls (to ensure customers aren’t kept waiting as the calls come in).
Alternatively, plotting sales data against online hype around a new game on forums or from particular locations can help a company find relationships between hype in particular places (virtual and physical) and actual sales.
How to bring different data types together to inform better decision making
Bringing together structured and unstructured data sources can sound like a nightmare, but there are solutions.
With the right tools, it’s easy to bring structure to your unstructured data, and to display all your data side by side.
To go back to our flying ant analogy, here are mentions of #FlyingAntDay in Greater London next to the average temperature in London that day.
It seems like a rise in temperature on 4 July is correlated with a sudden increase in mentions of flying ant day, which continued into a hot 5 July.
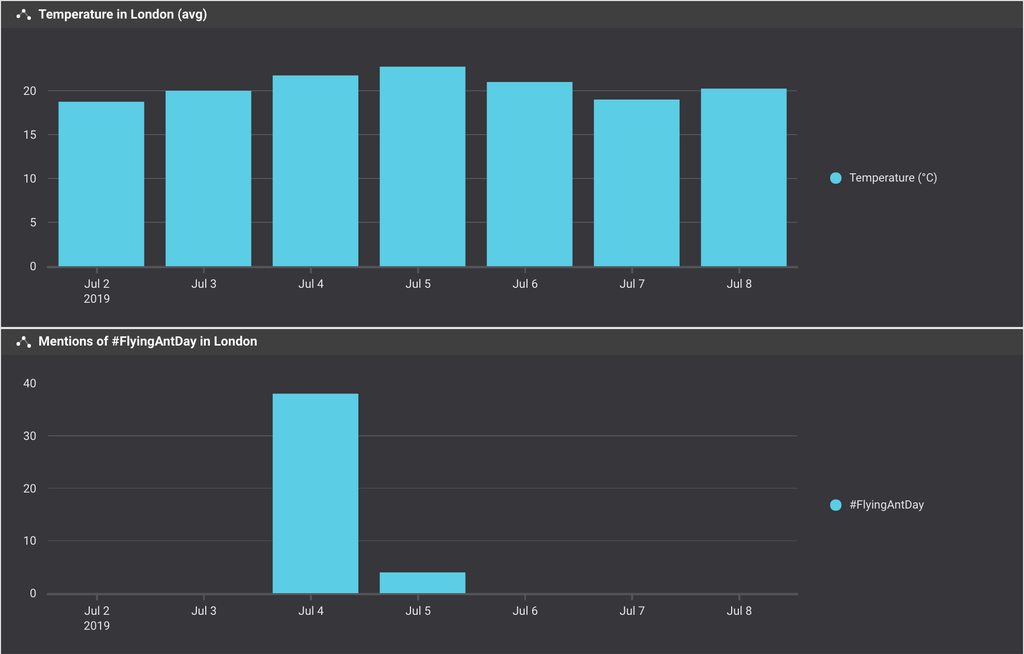
This mixture of structured weather data sourced online and unstructured social data sourced via Brandwatch Analytics was put together in minutes using a mix of Google Sheets and Brandwatch Vizia.
Meanwhile, with Brandwatch’s upcoming Consumer Research platform, you’ll be able to add your own unstructured data to sit alongside your social data. For example, you could upload:
- Survey data
- Customer support chat logs or call transcripts
- Product reviews
- NPS scores
Stay tuned for more!
By bringing structure to all this data you can compare it, identify patterns, and get a far more rounded view of your consumers.