logo

Brandwatch Bulletin #29: A Country’s Pandemic Spending Portrait

How spending changed week to week.

22 January 2021

Happy Friday to you all, and what a different world it is as we enter the weekend. Before you down keyboards and monitors, here’s today’s bulletin looking at UK consumer spending throughout the pandemic using a brand new data set.

Make sure to subscribe so you don’t miss next Monday’s bulletin.

Subscribe

No recovery for consumer spending in sight

A new dataset that’s interesting, regularly updated, and reliable is a fine thing. And this week the Office for National Statistics gave us a very fine example of one of those fine things.

From now on, once a week, the ONS will release the Bank of England’s Clearing House Automated Payment System (CHAPS) data. This shows how much people are spending on their credit and debit cards in the UK at around 100 major retailers.

In other words, you can track UK consumer spending trends week by week.

We decided to take a look at this data, which the ONS has handily indexed to February 2020 (before the pandemic was declared). This means we can trace the tumultuous journey of the country’s consumer spending throughout 2020, and all the way up to last week.

For more details on the methodology behind CHAPS data, and how it’s collected, here’s an explainer.

Now to the data. First, we looked at how spending levels have changed since February last year.

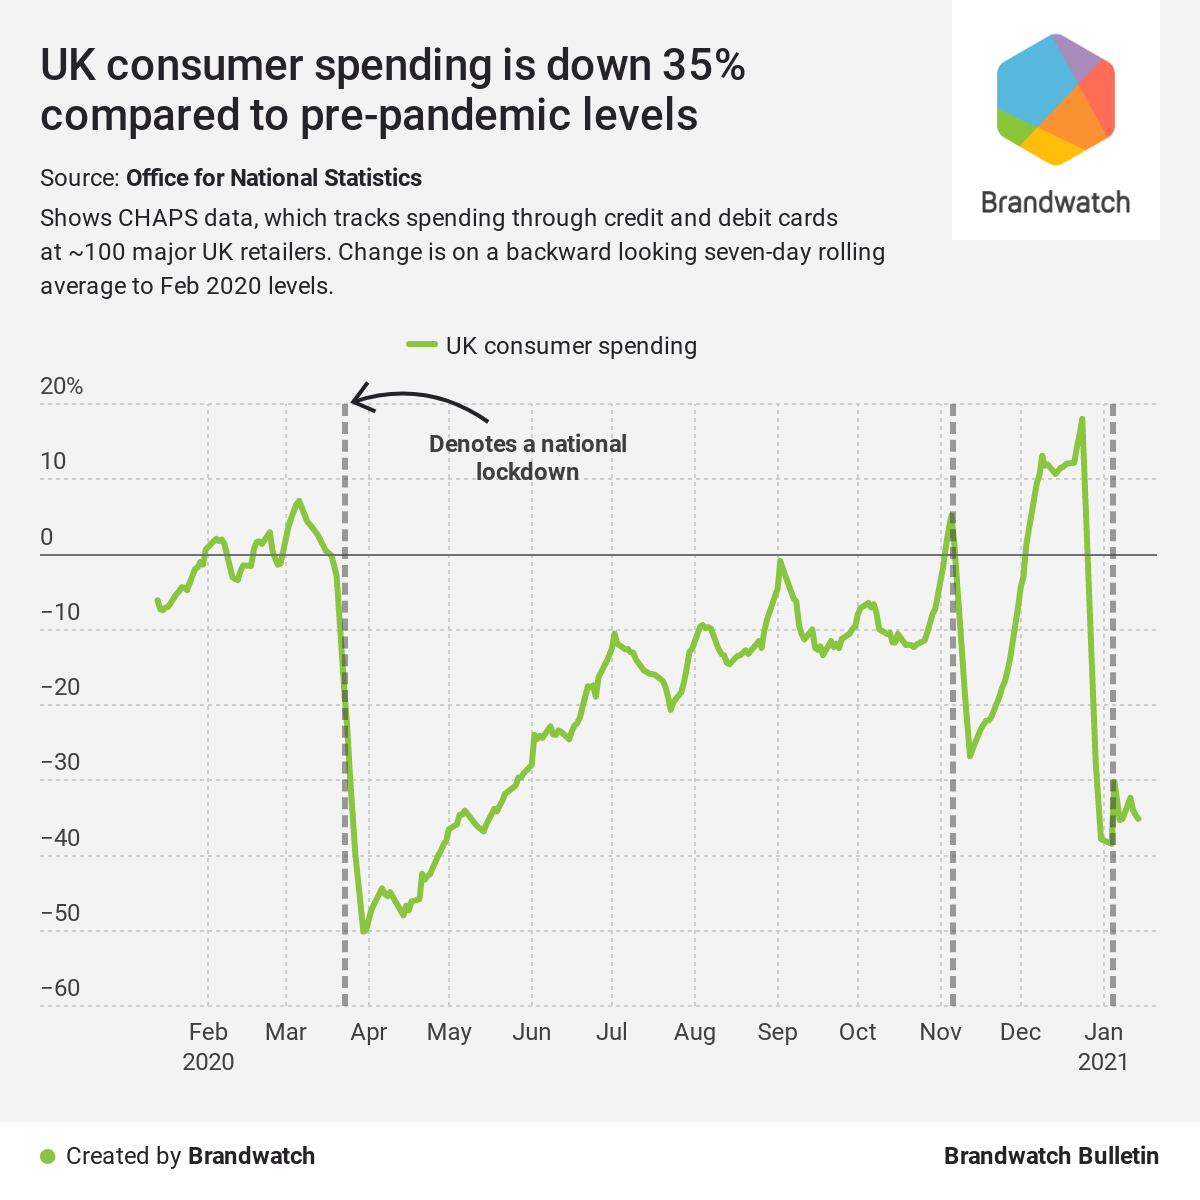
The data offers sparkling clarity on just how damaging the pandemic and ensuing lockdowns have been to the UK economy. In March, at its lowest ebb, consumer spending dropped by a staggering 50% as the first national lockdown came into force.

Recovery was, expectedly, slow. The national lockdown didn’t end until July 4 (although there was some easing beforehand). It looks like this caused a fall in consumer spending, but it could actually mark the return of usual spending patterns where levels jump after end-of-month paydays and fall as the month goes on.

Spending nearly returned to February levels in September, possibly pushed up by school supplies purchases. It wasn’t until early November that it exceeded February numbers, just ahead of another national lockdown when people bought up everything they needed to get through it.

With the second lockdown causing a far smaller drop in spending, it also saw a far sharper recovery come December when the lockdown ended. It should be noted that Christmas-related shopping will have buoyed this heavily.

And that brings us to January 2021, with a third national lockdown and a drop nearly as sheer as that seen in March 2020 (although seasonal post-Christmas belt tightening will have had an effect too). With no set end date to the UK’s current lockdown, and coming up to a year since the first one, consumer spending sits 35% below pre-pandemic levels.

It’s grave news for businesses across the board and, while there has been government support in various forms, many will be wondering how much longer they can last as 2021 wears on (if they have even managed to last this long).

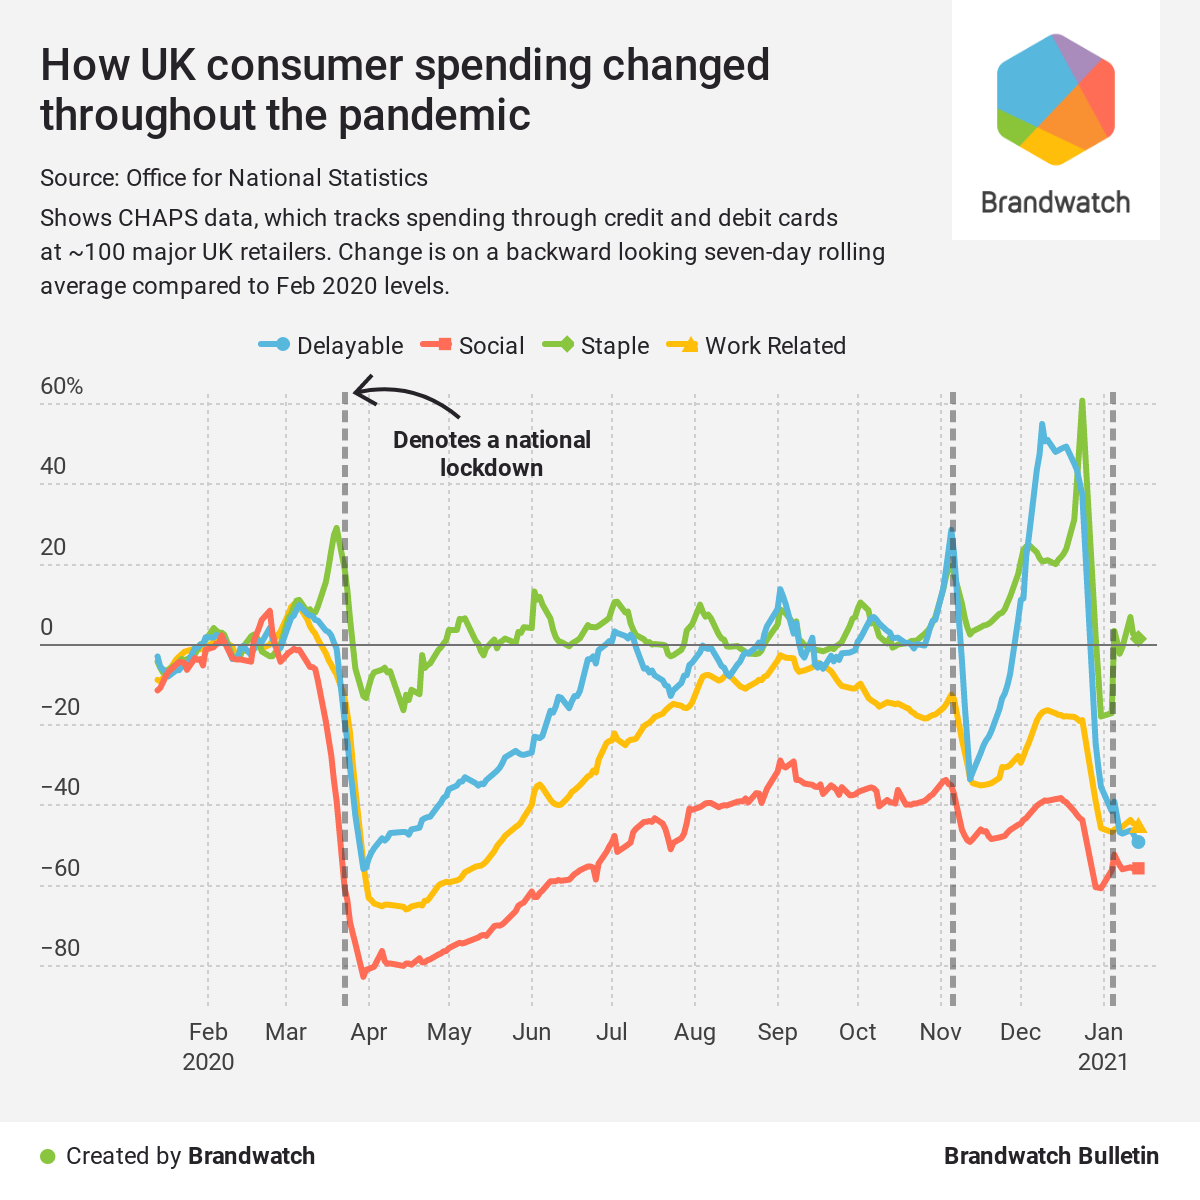
Different sectors, different strokes

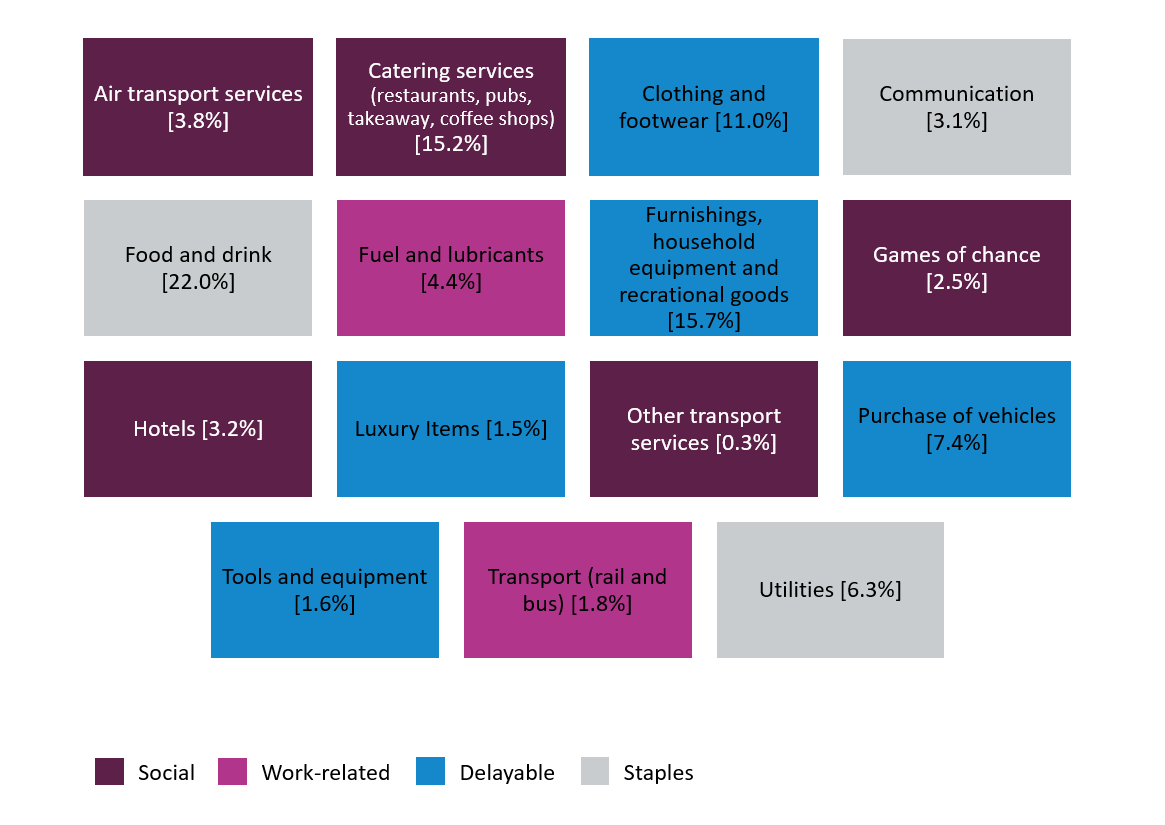
Usefully, the data can also be split out into the following categories:

  • Staples (food and drink, communication, utilities)
  • Delayable (clothing and footwear, vehicle purchases, household goods)
  • Work-related (public transport and fuel)
  • Social (air travel, games of chance, restaurants, bars, and hotels)

Here are some specifics from the ONS on what exactly falls into each category (the percentages refer to their portion of overall spending).

And here’s how that breakdown looks across the pandemic:

Instantly we can see that different sectors saw very different patterns during the pandemic and lockdowns. Notably, staples held particularly steady with a far smaller drop in March 2020 than the other categories.

This suggests that supermarkets fared far better than many other businesses. This tallies with many supermarkets returning Covid-19 tax relief to the government after seeing strong sales figures throughout the year.

On the other end of the scale is social spending. This dropped by 83% after the first lockdown, with its best showing since being -29%. This will not be a surprise. Places like bars and restaurants have obviously taken the brunt of lockdown measures and consumer safety wariness, particularly after losing a huge chunk of their Christmas trade.

Delayable purchases have seen a particularly interesting journey. After staples, they saw the strongest recovery, eventually getting to ‘normal’ levels just before the second lockdown. While a sharp drop followed, they recovered during the Christmas period in a way social spending was unable to, presumably due to gift shopping. But with another lockdown and New Year frugality, it’s now fallen away completely to near March 2020 levels.

All in all, this gives us an incredibly detailed picture of how a country’s spending can be influenced by Covid-19 and the measures put into place to fight it. With a long way to go, this data should be instructive to businesses looking to plan for the future, whether it’s in the face of looming lockdowns or the easing of restrictions.

You can find the data yourself here, with the next dataset released on January 28.

Thanks for reading

That’s it for today. Have a great weekend and we’ll see you Monday. Subscribe now so you don’t miss it.

Stay safe,

Brandwatch React Team

logo
  Our Suite     Use Cases     Industries     Get started  

Runtime Collective Limited (trading as Brandwatch). English company number 3898053
New York | Boston | Chicago | Austin | Toronto | Brighton | London | Copenhagen | Berlin | Stuttgart | Frankfurt | Paris | Madrid | Budapest | Sofia | Chennai | Singapore | Sydney | Melbourne

Privacy Policy

Update subscription preferences

Unsubscribe

We value your privacy

We use cookies and similar technologies to personalize ads and content (including by sharing data with Google), to measure site performance, and to improve your experience. Learn more in our cookie policy

Privacy & Safety • Terms of Service

No, take me to settings
Yes, I agree
More info.

By using our site you agree to our use of cookies —