logo

Brandwatch Bulletin 01/29: The World in Motion

Lots of data, little movement.

Here we are at the end of the week. In today’s bulletin we’re taking a look at transport and mobility data. What are levels like after a year of Covid-19? Now you can find out.

Don’t miss our future bulletins by clicking “subscribe” below.

Subscribe

A year of staying put

As we inch ever closer to a full 365 days of official pandemic-dom, we get a better look at the long-term trends Covid-19 has brought about.

Thanks to some incredible Apple data, we can get some fascinating insights into how collective mobility has changed over the last 12 months. This is measured using Apple Maps routing requests, which cover walking, driving, and transit (this refers to public transport).

You can download the data, which can be broken down into countries, cities, sub-regions, and counties, here. You can also follow that link to find more details on the data itself.

First, we used it to create a view of global mobility by averaging the data for each available country.

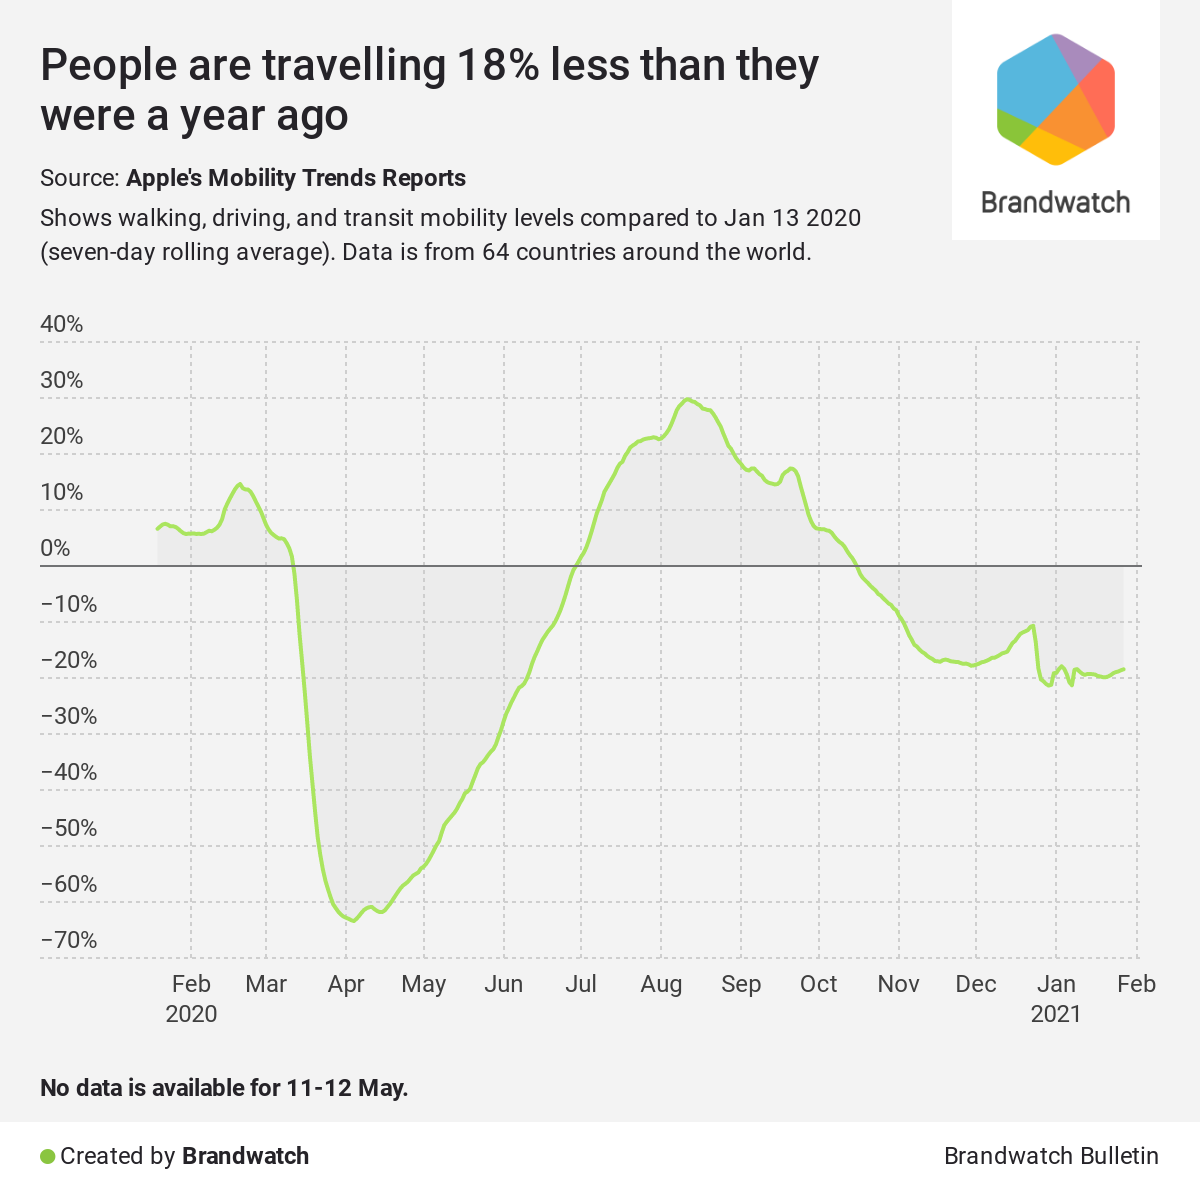
The drastic drop in mobility as Covid-19 spread around the world hit its extreme at the start of April. People were moving around 63% less than they were on January 13, a result of lockdowns and personal caution.

Eerily quiet streets, empty buses, and cars sat untouched in driveways across the globe. It was a bizarre time for us all, but it wasn’t long before we started to get back on the move.

Global mobility steadily increased from mid-April, eventually overtaking the data’s baseline level as we went into July. With lockdown measures eased in many places, growing confidence amongst the populace, and warmer weather in the northern hemisphere, mobility continued to increase.

It’s worth stopping to note here that while levels were increasing, they were likely far below what you would expect around this time in a normal year.

Seasonal trends will have contributed to the fall as we went past August. But as the year went on lockdown measures were tightened in various countries as outbreaks and second waves reared their heads.

Eventually we reach January 2021 where we can directly compare data to last year’s. Mobility is still down by nearly a fifth. While vaccination efforts are ongoing, global new Covid-19 case levels are at some of the highest we’ve ever seen.

In other words, we’re still far from “normal” mobility levels.

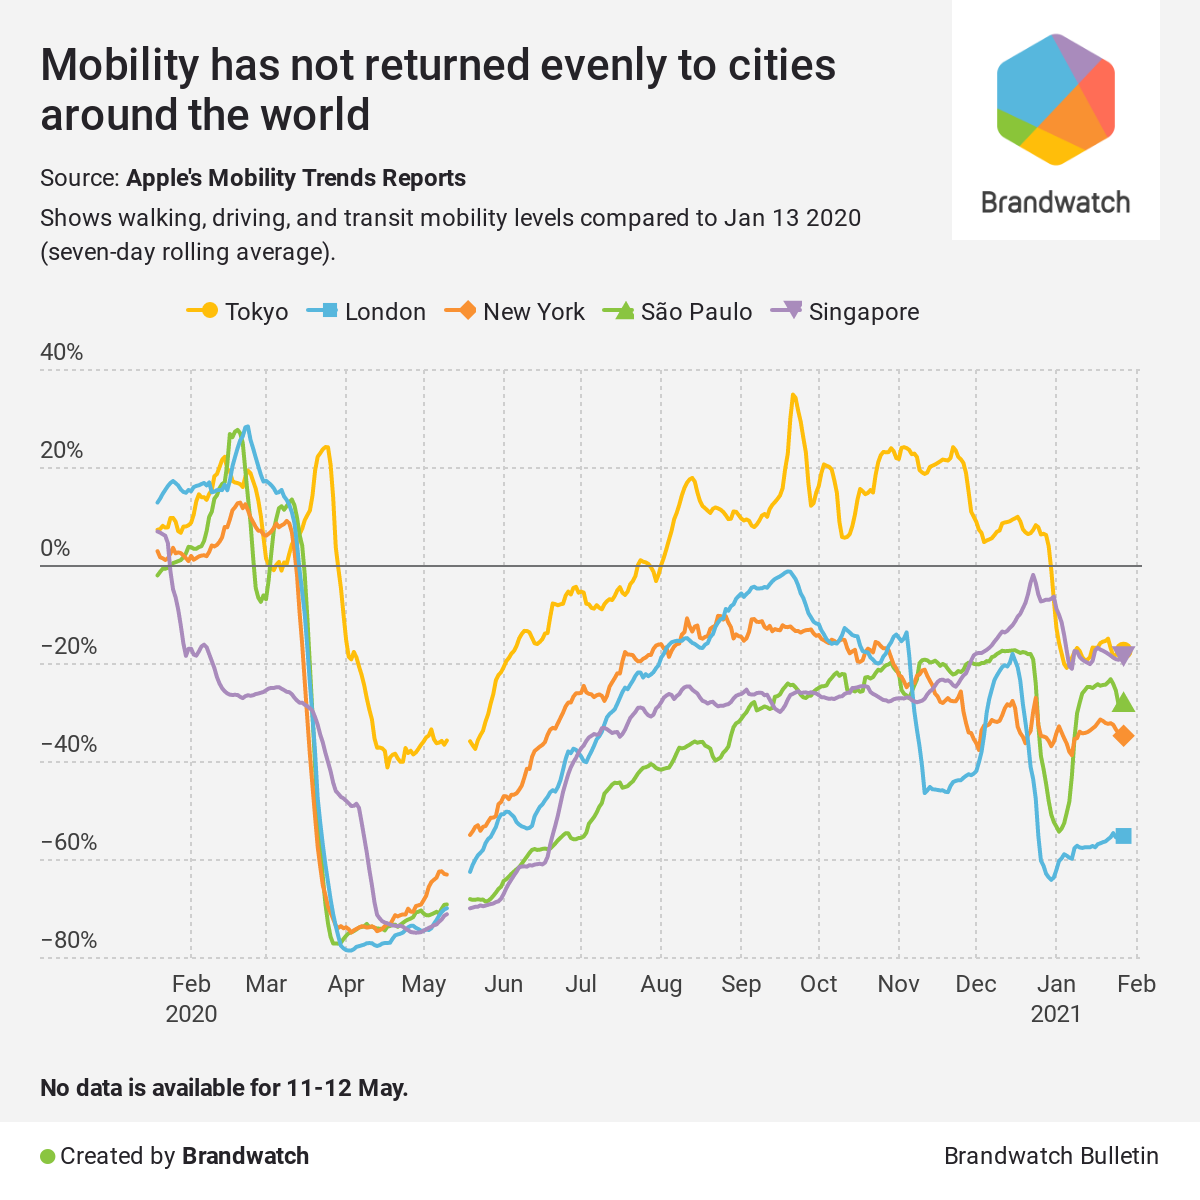
The picture isn’t identical everywhere, though. Here’s how the data looks for five major cities around the world.

We can see that all the cities share a similar overall shape with the global data, but it’s clear there’s a lot of variation at different points.

Take Singapore, for example. Mobility levels dropped off far earlier compared to other cities. We can’t be sure on the exact reasons but Covid-19 was taken very seriously early on, with restrictions and checks around travel to Wuhan and China implemented in January.

Tokyo is also particularly interesting. Firstly because of its big jump in mobility in late March, while numbers had fallen through the floor elsewhere. Why the boost in mobility? Again, there are too many factors at play for us to be completely sure, but the jump coincided with the city’s cherry blossom season.

Tokyo also saw far higher mobility from August through December than the other cities we analyzed. As with the global data, these levels are likely lower than normal, but they may reflect Japan’s success in fighting Covid-19. The country saw far less cases per capita in this period than the US, UK, Brazil, and Singapore.

As we move into January 2021, all cities are below where they were at the same time last year. This is particularly true with London. The city has been under restrictions for a long time (it’s now under a third national lockdown), and mobility levels are down 55% compared to this time last year.

There’s a long way to go before the world gets fully back on the move.

Webinar: How Nestlé uses Brandwatch

Join us, Nestlé, and Marketing Week for an informative and instructive webinar. We’ll be looking at how Nestlé drives innovation with consumer insights from our Consumer Research platform.

Sign up now.

Thanks for reading

That’s it for today. If you enjoyed today’s bulletin, make sure to subscribe to get more every Monday and Friday.

Stay safe,

Brandwatch React Team

logo
  Our Suite     Use Cases     Industries     Get started  

Runtime Collective Limited (trading as Brandwatch). English company number 3898053
New York | Boston | Chicago | Austin | Toronto | Brighton | London | Copenhagen | Berlin | Stuttgart | Frankfurt | Paris | Madrid | Budapest | Sofia | Chennai | Singapore | Sydney | Melbourne

Privacy Policy

Update subscription preferences

Unsubscribe

We value your privacy

We use cookies and similar technologies to personalize ads and content (including by sharing data with Google), to measure site performance, and to improve your experience. Learn more in our cookie policy

Privacy & Safety • Terms of Service

No, take me to settings
Yes, I agree
More info.

By using our site you agree to our use of cookies —