logo

Brandwatch Bulletin #109: Are You Customer Experienced?

Will someone think of the social media managers?

4 March 2022

Most of us have complained online at one time or another, which means there’s a huge swathe of data on customer experience out there. Today’s bulletin looks at the insights we can pull from all those posts.

Let’s get to it.

Subscribe to the Brandwatch Bulletin

It’s a customer’s world

It’s now standard for people to take their customer complaints and queries straight to social media. Whether it’s asking about a cancelled flight or chasing up a purchase, brands have had to figure out the most effective way of dealing with these communications.

In our brand new customer experience report, we’ve used Brandwatch Consumer Research to analyze these types of posts. We tracked 550 top brands across 14 sectors between July and December last year, collected 140m posts, and then looked at the emotion and sentiment behind them.

You can read the full report here, but here’s a sneak peek at some of the data.

Sentiment stats

Getting it right is not always easy, but some brands will find it much harder than others. Unfortunately some sectors just have a much tougher time of it online.

For the social media managers out there running fashion and entertainment brand accounts, you should be thanking your lucky stars. Compared to other sectors, posts about these types of brands are very positive, while the picture is fairly sunny for the hotel, retail, and food services industries too.

For those running consumer tech and consumer packaged goods (CPG) accounts, some days are clearly better than others. Particularly for consumer tech, this highlights our love/hate relationship with our technology. So much joy when it brings us hilarious memes, so much anger when it breaks without warning.

And for those in charge of energy and pharma accounts, we feel for you. They get, by far, the most negative response on social media (though this isn’t a surprise considering they’re literally life and death sectors).

This kind of data can be helpful for brands looking to set benchmarks around brand health – how does sentiment around your brand compare to the average for your sector?

Feeling emotional

Let’s take a more segmented look at the data and bring in some emotion analysis. Again, the kind of online posts a brand will face really depends on its sector.

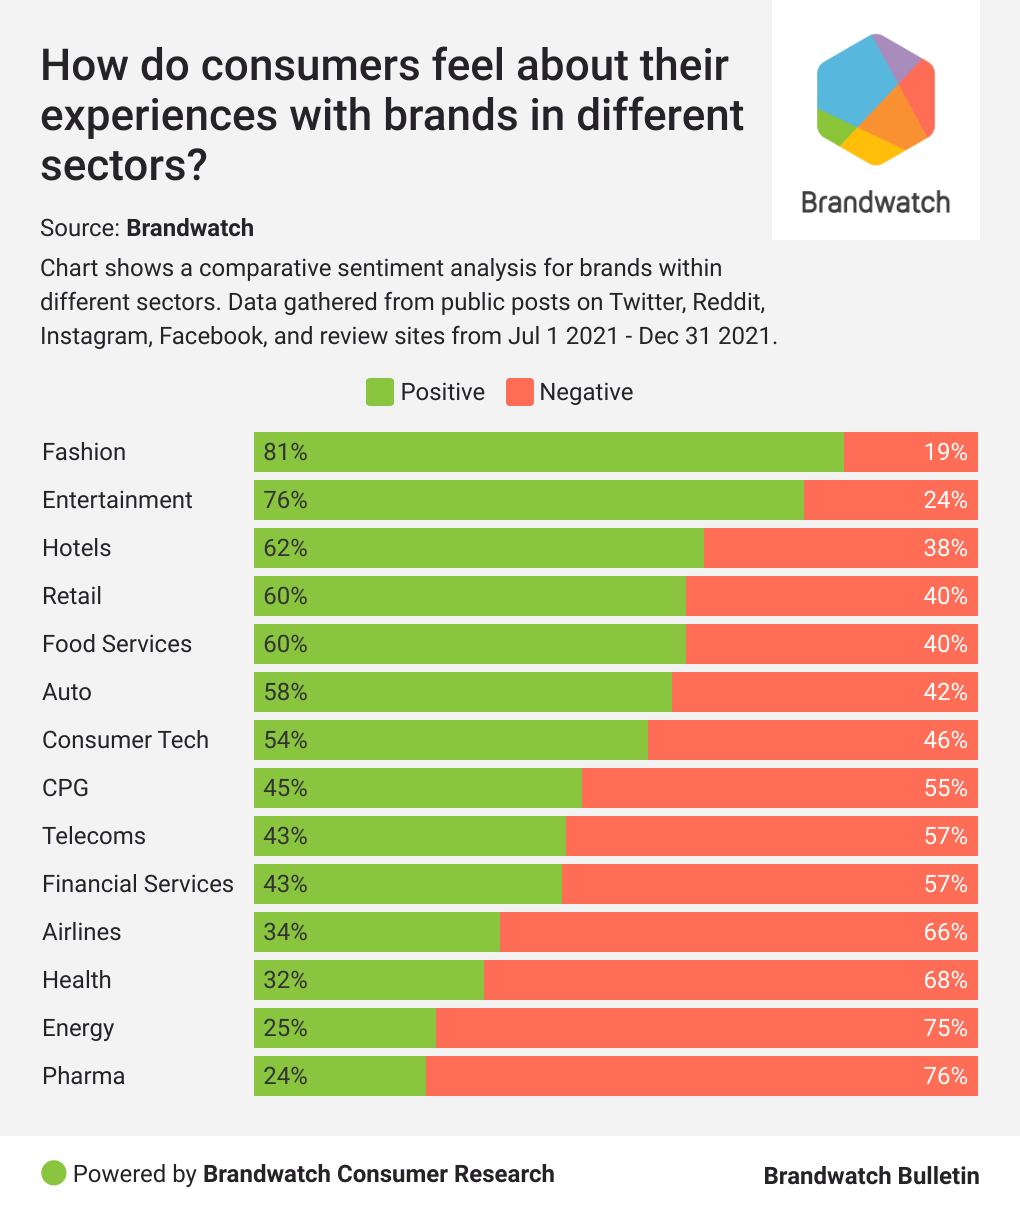
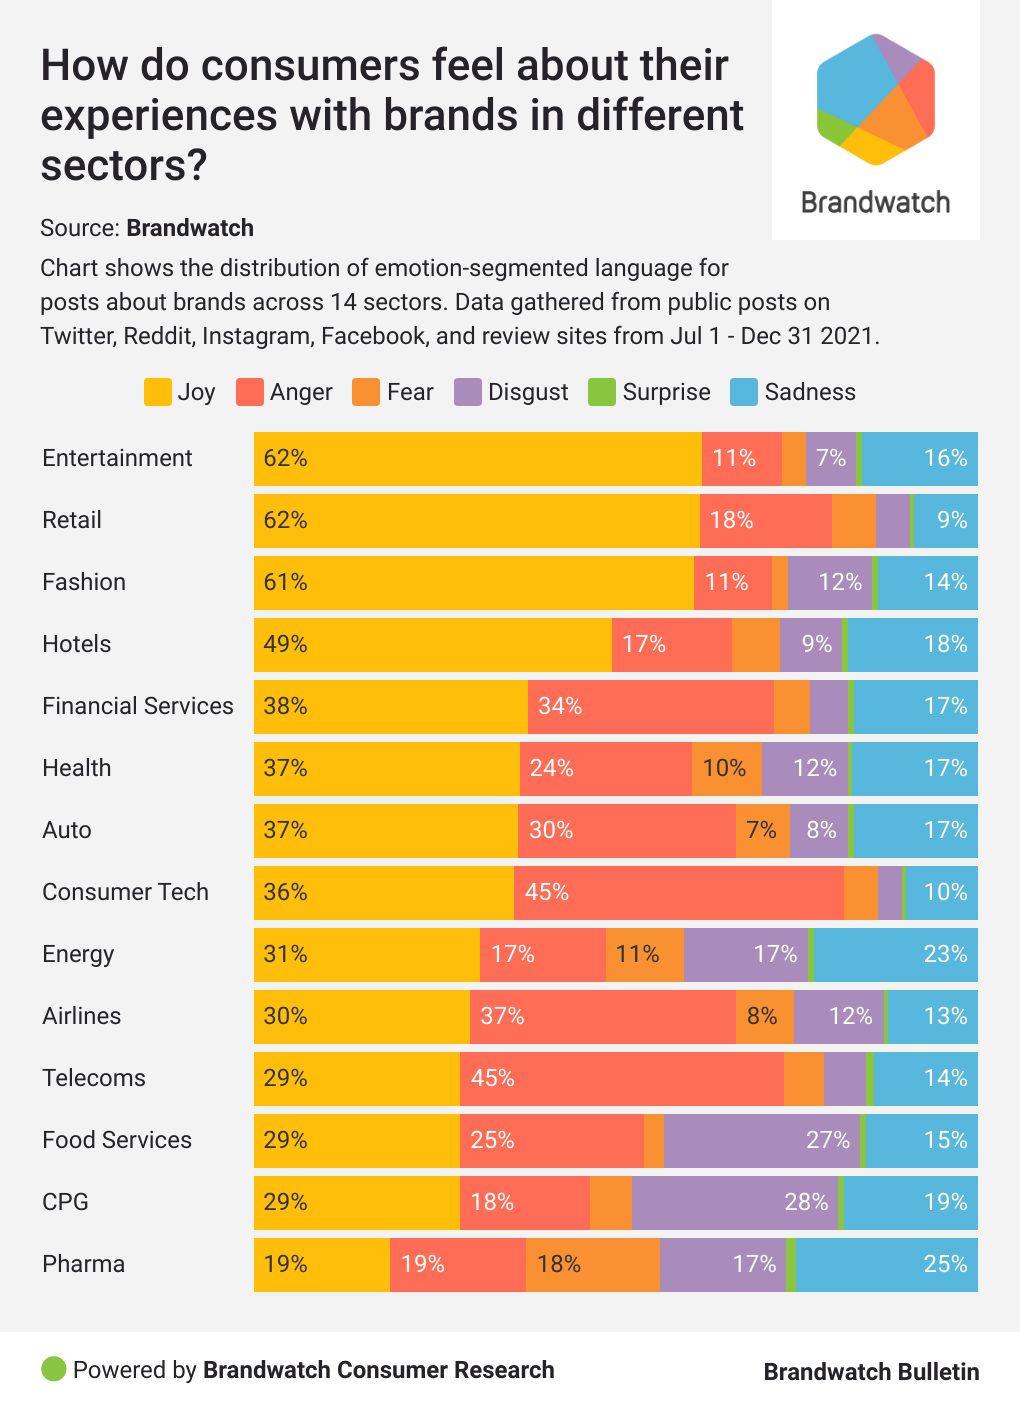
When it comes to being awash with heartfelt and praising mentions, entertainment, retail, and fashion brands are way out in front with joyful posts making up over 60% of their emotion-categorized mentions.

If blistering rage is more your thing, you’ll want a role at a consumer tech or telecoms company. Consumer tech’s numbers here again tally with the love/hate relationship we noted before, with the sector getting a good chunk of joyful mentions too.

Our other emotion leaders are:

  • Fear: Pharma (18%) and energy (11%)
  • Disgust: CPG (28%) and food services (27%)
  • Surprise: Pharma (1.2%) and telecoms (1.1%)
  • Sadness: Pharma (25%) and energy (23%)

We’ve gone into lots of detail on the reasons behind these numbers in our customer experience report but, because the Brandwatch Bulletin is a generous resource, we’ve picked out a few examples below.

What sparks joy for the financial services sector?

Digital wallet brands like Venmo, GCash, and PayPal received the highest percentage of positive mentions in conversations compared to other brands in our financial services group. Some people discussed projects they worked on and mentioned that they accept digital payments, while others mentioned these brands in conversations about raising funds and accepting donations.

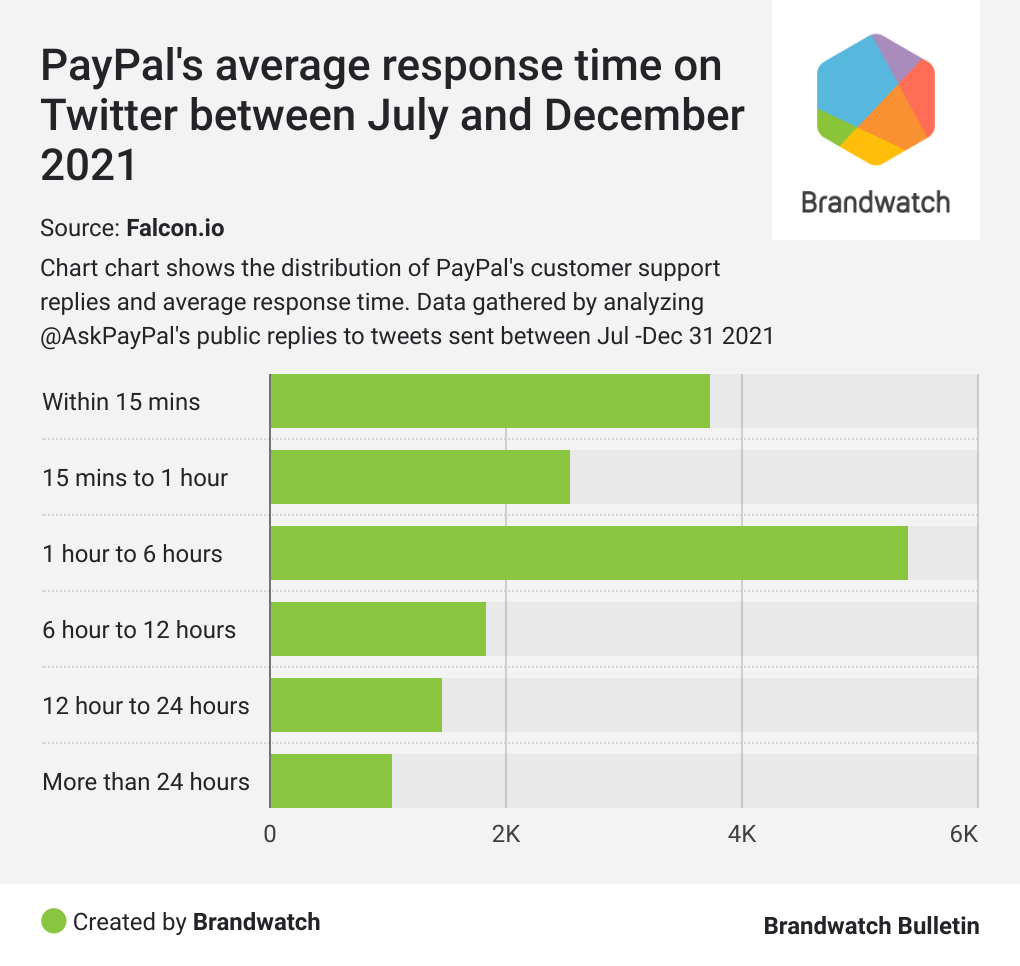
These brands also use their social media channels to provide prompt customer service. PayPal, for instance, has a dedicated Twitter handle (@AskPayPal) to provide support to its users.

It’s critical for brands in the financial services industry to have a low average reply time (ART), and PayPal looks to be doing well. The brand’s ART in the second half of 2021 was 7 hrs, 19 mins, 25 secs.

What sparks anger in the food services industry?

Food delivery services generated many negative mentions. Consumers expressed their support for delivery workers amid rising issues surrounding their working conditions. Many consumers also voiced their concerns around the transparency of transactions placed via food delivery apps.

Poor customer service and wrong or missing items were also present in discussions about food service brands as consumers vented on social when deliveries weren’t up to scratch.

Read the full report for free

There’s a ton more insight and analysis in the Brandwatch Customer Experience Report 2022, including:

  • The specific brands who have the best customer experience
  • Detailed analyses for each sector
  • The lessons brands need to learn

Read the full report now.

What should we cover next?

Is there a topic, trend, or industry you’d like us to feature in the Brandwatch Bulletin? We want to hear your ideas to make sure our readers are getting what they want. We may even ask to interview you if you’re involved with the topic.

Send any and all ideas to [email protected] and let’s talk.

Thanks for reading

That’s it for today, but we’ll be back next Friday. If you were forwarded this email and want in on the action, get subscribed to the Brandwatch Bulletin now.

Stay safe,

The Brandwatch Bulletin team

logo
  Our Suite     Use Cases     Industries     Get started  

Runtime Collective Limited (trading as Brandwatch). English company number 3898053
New York | Boston | Chicago | Austin | Toronto | Brighton | London | Copenhagen | Berlin | Stuttgart | Frankfurt | Paris | Madrid | Budapest | Sofia | Chennai | Singapore | Sydney | Melbourne

Privacy Policy

Update subscription preferences

Unsubscribe

We value your privacy

We use cookies and similar technologies to personalize ads and content (including by sharing data with Google), to measure site performance, and to improve your experience. Learn more in our cookie policy

Privacy & Safety • Terms of Service

No, take me to settings
Yes, I agree
More info.

By using our site you agree to our use of cookies —