logo

Brandwatch Bulletin #03: A Data Analysis of Soup Season

We've got the dates.

14 September 2020

Welcome back to the Brandwatch Bulletin. This Monday we’re tackling a not-so-serious topic, that comes with some seriously useful lessons for understanding the world and how your organization fits into it.

Don’t miss out on future bulletins. Click the button below.

SUBSCRIBE

Defining soup season with data

As the days grow shorter in the Northern Hemisphere and fall creeps closer, a lot begins to change. We dig out sweaters from the backs of cupboards, accept that the last beach trip of the year is behind us, and, most importantly, we start to talk about soup a lot.

In other words, we enter soup season.

We decided to bring some data to this topic, take it too seriously, and find out exactly when soup season officially begins, and how long it lasts. To do this, we looked at mentions of soup, and pictures of the dish, posted online between 2011 and 2019.

Using these nine years of data we worked out the amount of soup posts made in the average week, and then overlaid each individual week’s average amount across the same time period.

Just like making soup, it’s a little messy. Specific dates don’t always fall on the same day of the week each year, while using daily numbers was also tricky due to some days being above average, only to then be followed by a week’s worth of below average numbers.

But, with a little playing around with our weekly and daily figures, we’re happy to officially claim the following dates for soup season:

Start date: September 17 (the first day after summer that soup posts go 10% above average)

Peak soup season: January 20 (soup mentions are at their highest)

End date: March 31 (the first day after winter that soup posts go 10% below average)

We should note that we exclude the Christmas period when choosing these dates as people just generally post less around this time. Also April does see a short jump in soup mentions, but we believe this is caused by a couple of anomalous events, and comes after a break in consistently above-average soup post levels.

To go along with these auspicious dates we’ve conjured into existence, we also found out what types of soups were most discussed online. Unfortunately we had to exclude chicken noodle soup as its numbers were massively skewed by the release of ‘Chicken Noodle Soup’, a song by K-pop megastar J-Hope.

While this exercise may seem like a little bit of fun, it has some valuable applications for businesses and organizations.

It’s an excellent way to discover if topics or products have some kind of seasonal interest. This can obviously be used to plan marketing activities and campaigns around.

Essentially, you can run anything through our process to find out its ‘season’, so here’s a quick rundown on how to do it using our Consumer Research platform.

How to work out your own ‘seasons’

First, set up your query to track the topic you’re interested in. It could be anything from a general topic, to a specific product you sell. It doesn’t matter as long as it’s something that gets discussed online a decent amount.

Make sure to backfill your query as far as possible. The more years you include, the better your averages will be. But be sure to check for any major events that may have influenced numbers in a specific year. In some cases, it might be worth excluding this data to avoid skewing your results.

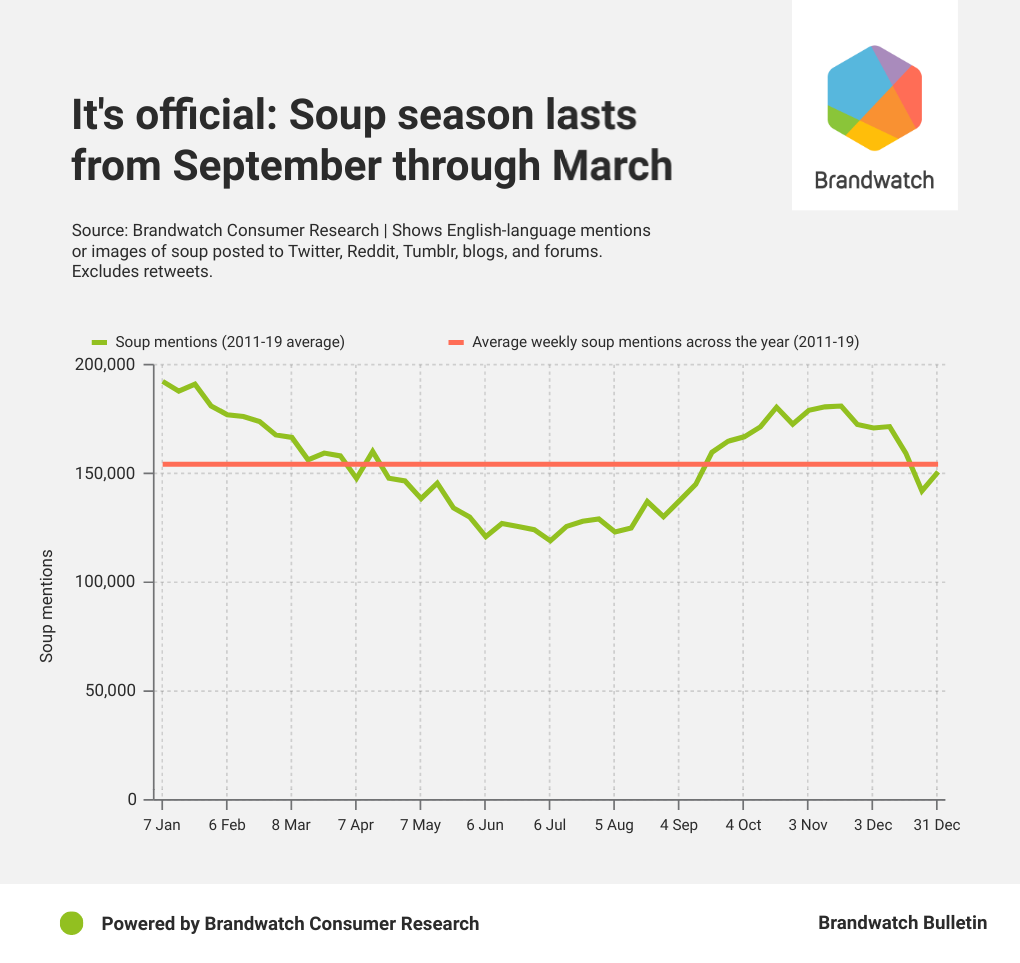
Once your query has run, set up a table component to show the number of mentions your topic got per your chosen time period (day or week or month) each year. Export this data, and then use your preferred spreadsheet tool to get an average for each individual period.

Then work out the average of them all together. For days, this would mean adding together the averages you just worked out for each day, and dividing the total by 365. That will give you your average mentions per day across the year.

You’ll use this figure as a baseline to see when your topic is being discussed above or below average. From there you can mark out your topic’s seasonality.

You don’t have to do this with online mentions though. Any data source, such as call logs, could be turned to the same process. You can even upload your own data to the Consumer Research platform as well, making things nice and easy.

Finally, what would a bulletin about soup be without some recipes?. Here’s a few of the most popular ones we found during our research:

  • Thai noodle soup with shrimp & pumpkin
  • Chrissy Teigen’s chicken pot pie soup
  • Spicy Thai lobster soup
  • Chicken soup
  • Split pea soup

Happy cooking, and happy eating.

Get weekly US election polling data

We’re running weekly Qriously surveys to poll the American people on who they’ll vote for in November. Every Wednesday we’ll send out a bulletin with the latest results, along with responses on the events of the week.

Get our latest polling data every Wednesday.

Thanks for reading

That’s it for today. The Brandwatch Bulletin is back on Friday, so sign up here to make sure you don’t miss it.

Stay safe,

Brandwatch React

logo
  Our Suite     Use Cases     Industries     Get started  

Runtime Collective Limited (trading as Brandwatch). English company number 3898053
New York | Boston | Chicago | Austin | Toronto | Brighton | London | Copenhagen | Berlin | Stuttgart | Frankfurt | Paris | Madrid | Budapest | Sofia | Chennai | Singapore | Sydney | Melbourne

Privacy Policy

Update subscription preferences

Unsubscribe

We value your privacy

We use cookies and similar technologies to personalize ads and content (including by sharing data with Google), to measure site performance, and to improve your experience. Learn more in our cookie policy

Privacy & Safety • Terms of Service

No, take me to settings
Yes, I agree
More info.

By using our site you agree to our use of cookies —