logo

Brandwatch Bulletin #87: Post-Lockdown Consumer Spending

A case study.

10 September 2021

Welcome to today’s bulletin where we’re looking at how UK consumer spending is faring post-lockdown, and with fall on the way.

Let’s get to it.

Subscribe to the Brandwatch Bulletin

Hello again, old CHAPS

Covid-19’s effect on consumer spending has been a topic of huge importance and interest throughout the pandemic. What people have also wanted to know is how this changed when an economy lifted lockdowns and reopened.

We’ve been covering this periodically by using the UK as a case study, and today it’s time for another look. It’s an interesting time to see where things are as summer is coming to a close, students are going back to school, and the latest data release covers the August bank holiday and pay day.

To conduct our analysis we’re using the Bank of England’s Clearing House Automated Payment System (CHAPS) data. This shows how much people are spending on their credit and debit cards in the UK at around 100 major retailers.

Indexed to February 2020, the data allows us to track UK consumer spending on a near day-to-day basis (there’s no data on weekends and bank holidays when the banks are closed) compared to pre-pandemic levels. The latest datasets also give us monthly aggregates too.

For more details on the methodology behind CHAPS data and how it’s collected, here’s an explainer.

Now to the data. First, we looked at how aggregate spending levels have looked month-to-month since the pandemic began, and what the situation is as the leaves are yellowing and Halloween beckons.

What stands out is that consumer spending has only once risen above pre-pandemic levels when looking at monthly data. That occurred in December 2020 with spending spurred on by Christmas and pre-lockdown stocking up.

After that month’s lockdown spending plummeted again, steadily rising until May when levels dipped slightly. They’ve remained fairly stable since.

The country fully reopened on July 19, which meant August was the first full month everything went back to ‘normal’ and yet spending only increased slightly. There’s a lot of factors at play here, but the ‘pingdemic’, which heavily disrupted economic activity, will have played a big role in dampening spending.

On the plus side, August spending was up seven percentage points year-on-year.

Now let’s take a more granular look by switching to the daily (excluding weekends and bank holidays) data for 2021.

This is maybe a more encouraging picture as we can see that there have been a few days that exceeded pre-pandemic spending levels. Although short-lived it shows just how close things are, and there is a stronger sense that levels are slowly trending up.

It’s impossible to ignore that Covid cases in the UK are rising, making it hard to predict what the coming months hold. The virus often thrives in the winter months as people spend more time indoors, which increases the likelihood of another lockdown. And as we know, with a lockdown comes crashing consumer spending.

Breaking things down by spending category

That’s the big picture, but what happens when we look a little closer?

Usefully, the data can also be split out into the following categories:

  • Staples (food and drink, communication, utilities)
  • Delayable (clothing and footwear, vehicle purchases, household goods)
  • Work-related (public transport and fuel)
  • Social (air travel, games of chance, restaurants, bars, and hotels)

Here are some specifics from the ONS on what falls into each category (the percentages refer to their portion of overall spending).

Now let’s see how spending looks broken down along these lines.

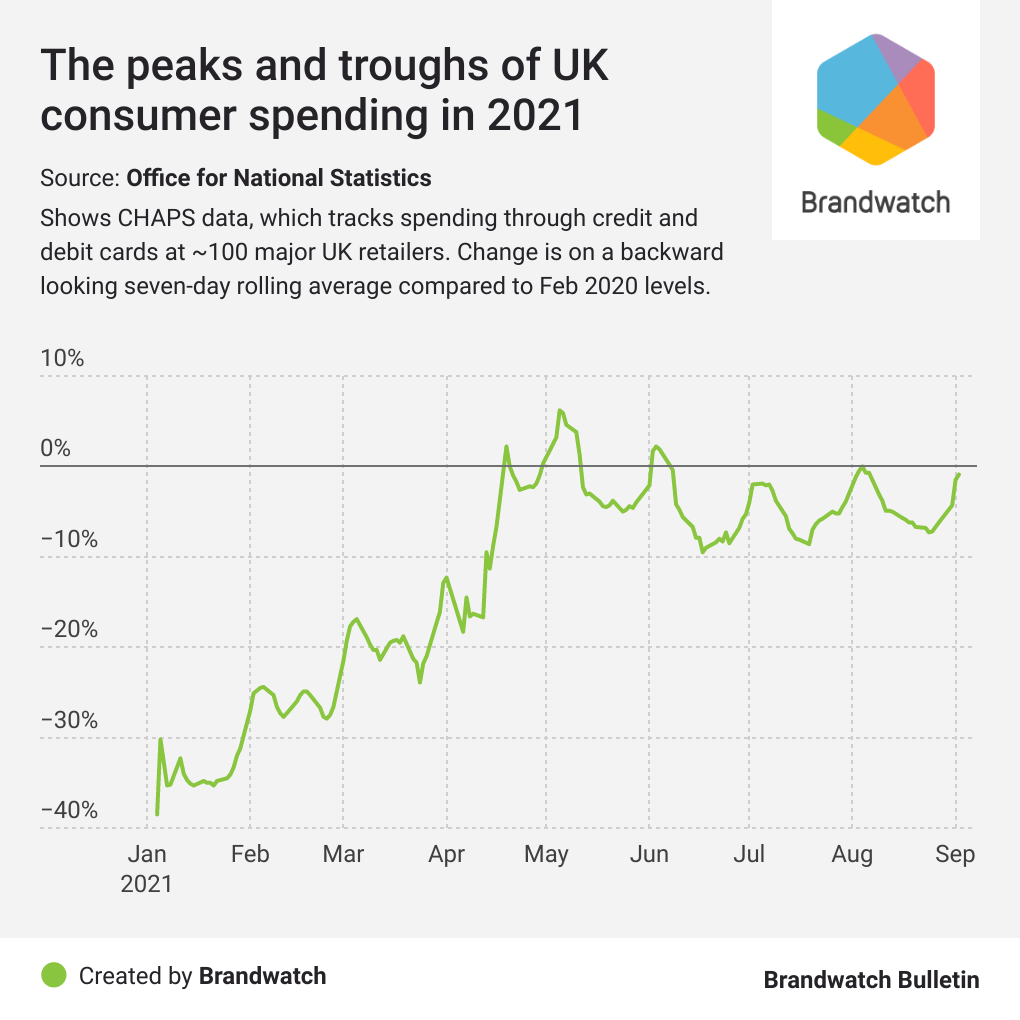
We previously talked about the data up to June, so let’s focus on July onwards today.

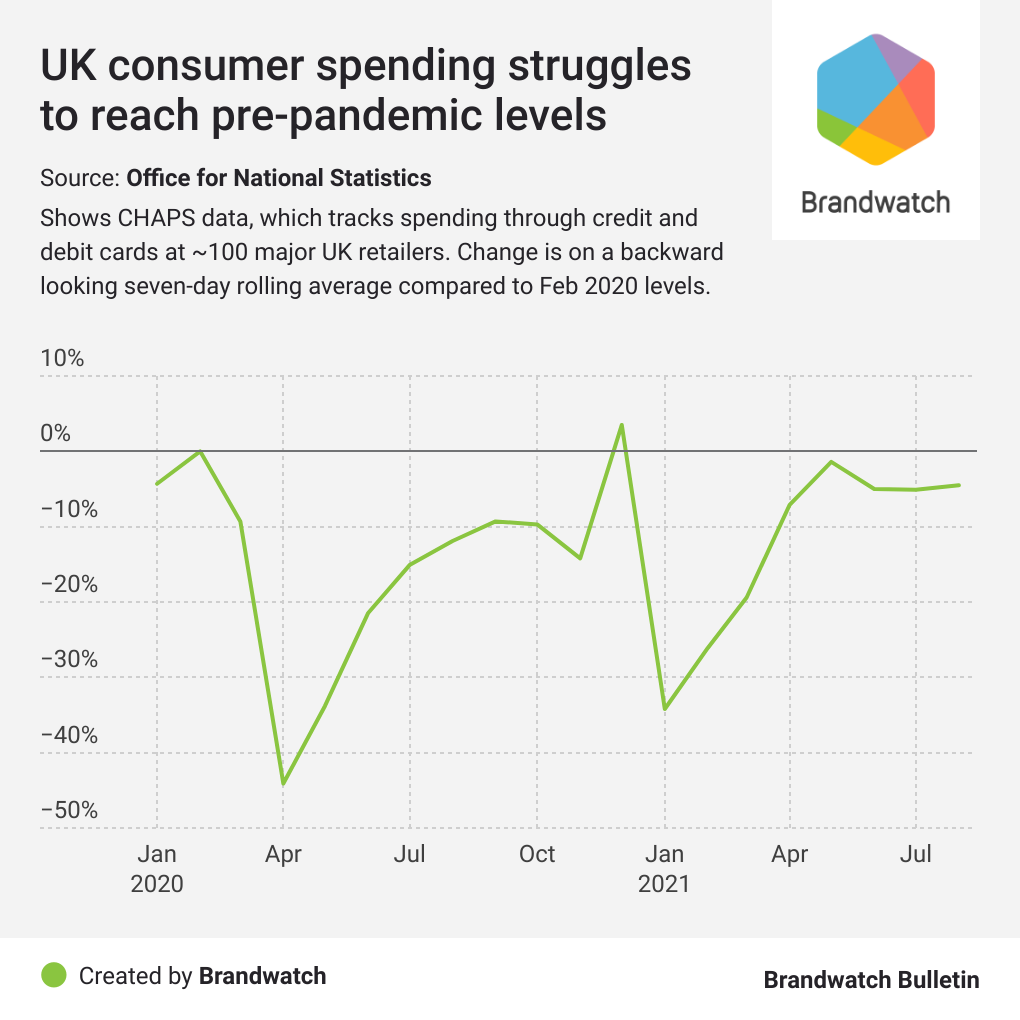
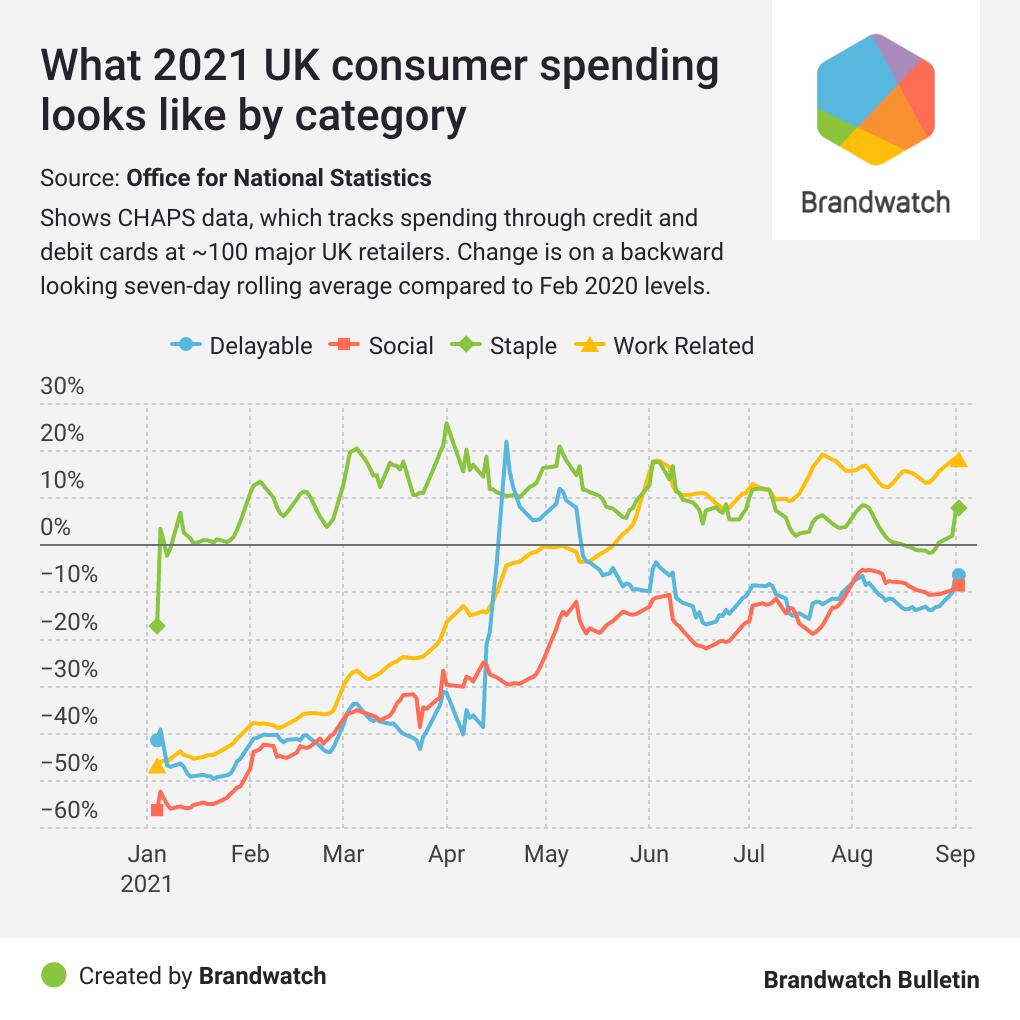
What’s clear is that while aggregate consumer spending is down on February 2020 levels, that’s not the case for all categories.

Spending on staples has practically been above pe-pandemic levels the entire year, only falling below briefly in August. This makes sense as these are generally what we consider the ‘essentials’ meaning they’re often the first items any money is assigned to.

Looking at work related spending, we can see this gradually rose throughout the year as people returned to work. It spiked in June as further restrictions were lifted, and has been slowly increasing since.

With work related spending above pre-pandemic levels, does that mean more people are commuting now? That seems unlikely. We can guess that some of this rise will be due to higher fuel prices and transport costs.

Turning to delayable spending, this has remained fairly steady since June, peaking around payday, and reaching its lowest ebb in the middle of the month.These levels are significantly below what they were pre-pandemic which suggests people either don’t have the cash for this category, or are reluctant to spend too freely yet.

We’ll finish off with social spending. The hospitality sector may look at these numbers with some unease. Considering summer should be a prime time for pubs and restaurants, not to mention sports events like the Euros usually bumping up spend, levels are still down by 9% as we enter September.

That’s certainly not the worst shape they’ve been in, but unless significantly more people start eating and drinking out, or have the money to do so, times are looking tough in this area. And that’s with the hope another lockdown can be avoided.

If you want to take a look at the CHAPs data, you can find it here, with the next dataset released on September 16.

What should we cover next?

Is there a topic, trend, or industry you’d like us to feature in the Brandwatch Bulletin? We want to hear your ideas to make sure our readers are getting what they want. We may even ask to interview you if you’re involved with the topic.

Send any and all ideas to [email protected] and let’s talk.

Thanks for reading

That’s it for today, but we’ll be back next Friday. Have a great weekend. And if you were forwarded this email and want in on the action, get subscribed to the Brandwatch Bulletin now.

Stay safe,

The Brandwatch React team

logo
  Our Suite     Use Cases     Industries     Book a meeting  

Runtime Collective Limited (trading as Brandwatch). English company number 3898053.
New York | Brighton | London | Berlin | Stuttgart | Singapore | Sydney | Paris.

Update subscription preferences

Unsubscribe

We value your privacy

We use cookies to improve your experience and give you personalized content. Do you agree to our cookie policy?

No, take me to settings
Yes, I agree
More info.

By using our site you agree to our use of cookies —