US Election Bulletin 09/30: Latest Poll Data and Supreme Court Changes

Do the people want Supreme Court term limits?

Welcome to our fifth US Election Bulletin. It comes as last night’s debate is picked apart, spun, and analyzed by the world. It was a messy and boisterous affair, and it will be interesting to see what effect it may have on our next poll.

For the meantime, along with our latest poll results, we’ve got data on what debate topics Americans thought were most important, plus their views on Supreme Court changes and statehood for Washington, DC and Puerto Rico.

If you want to get our results next week straight away, sign up below.

SUBSCRIBE

The results: Joe Biden: 49%, Donald Trump: 38%, undecided: 10%

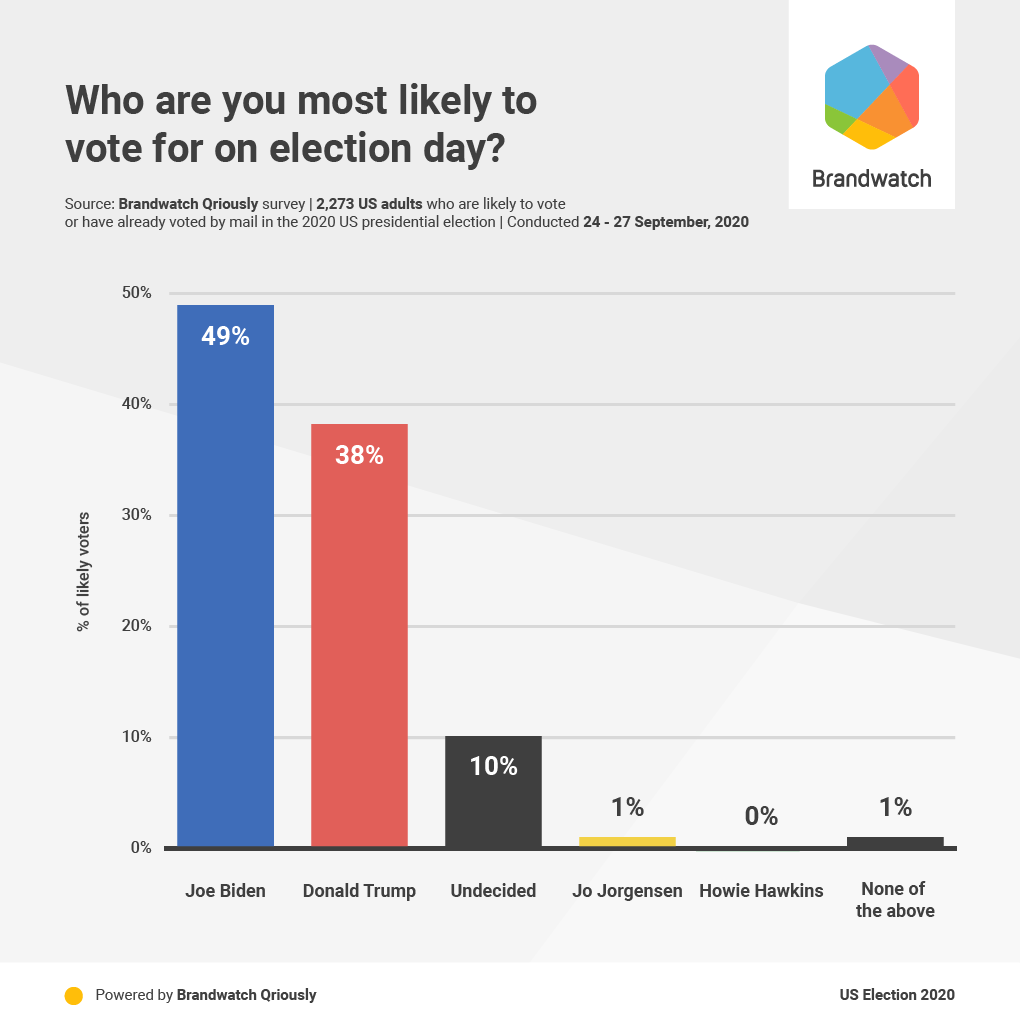
Using Brandwatch Qriously, we surveyed 3,384 American adults from September 24 to September 27 2020. The above results come from the 2,273 respondents who say they are likely to vote or have already voted by mail in November’s election. (After weighting, this is 55.9% of the overall sample).

Biden leads with 49% of likely voters supporting him against Trump’s 38%, a margin of +11. A further 10% of voters say they’re undecided, meaning there are still many Americans yet to back a candidate.

As we do every week, we’re releasing our polling data along with our bulletin. If you want to have a dig around or do your own analysis, you can find our tables and the raw data here.

The undecided

Throughout our polling, we’ve found a big chunk of likely voters who are yet to make up their minds. This week it was a tenth of likely voters, which could be enough to sway the election in either direction. We decided to get a bit more information from them.

We asked them which way they’re leaning, with the question “If you had to choose a candidate today, who would you vote for?”.

These undecided voters are split fairly evenly: 15% chose Trump, 12% chose Biden, and a further 10% chose a third party candidate or “None of the above”. This leaves 63% of undecided likely voters answering “I don’t know”, indicating they really aren’t leaning one way or another.

If we allocate the “leaning” voters to their respective candidates, the headline figures become: Biden 50%, Trump 40%, Jorgensen 1%, Hawkins 1%, none of the above 2%, and 7% still undecided.

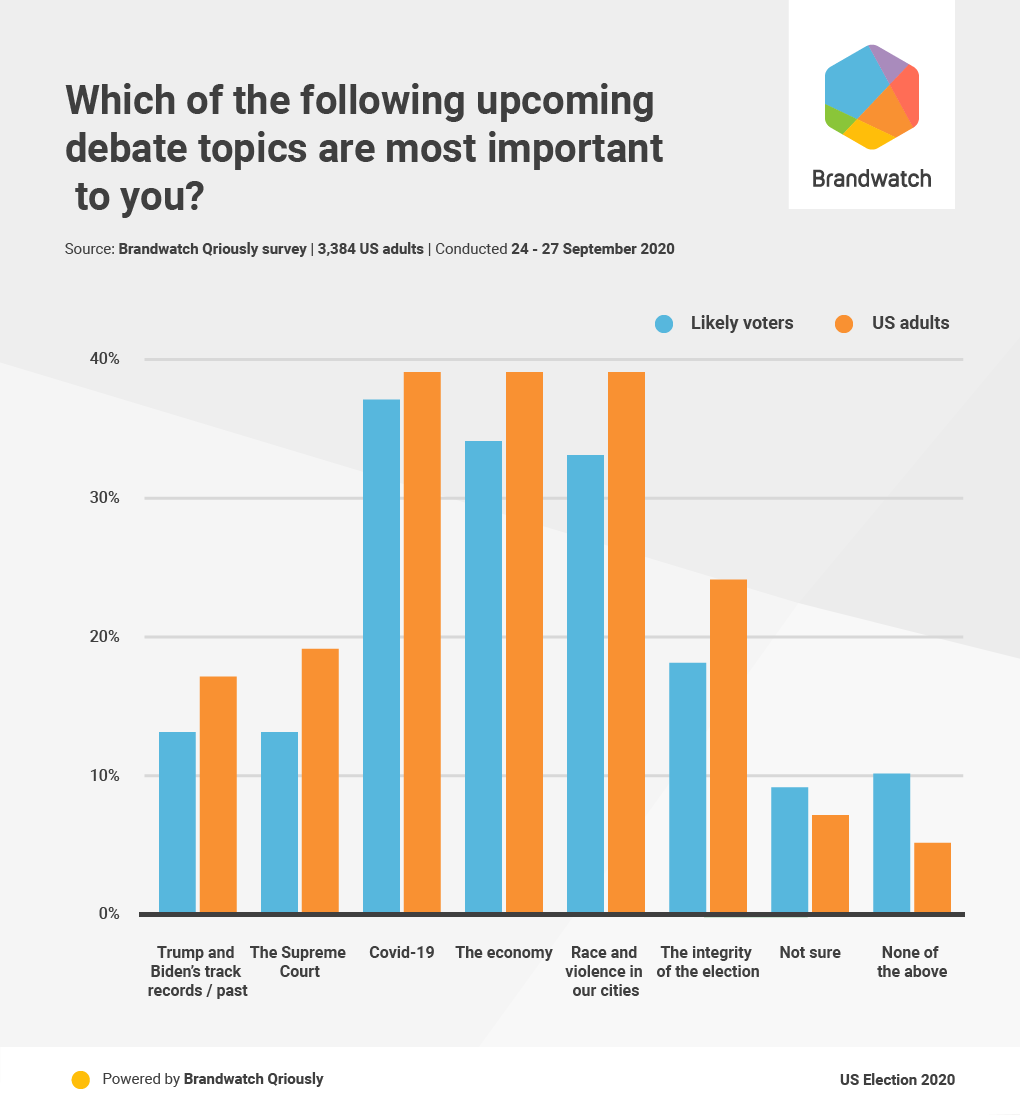
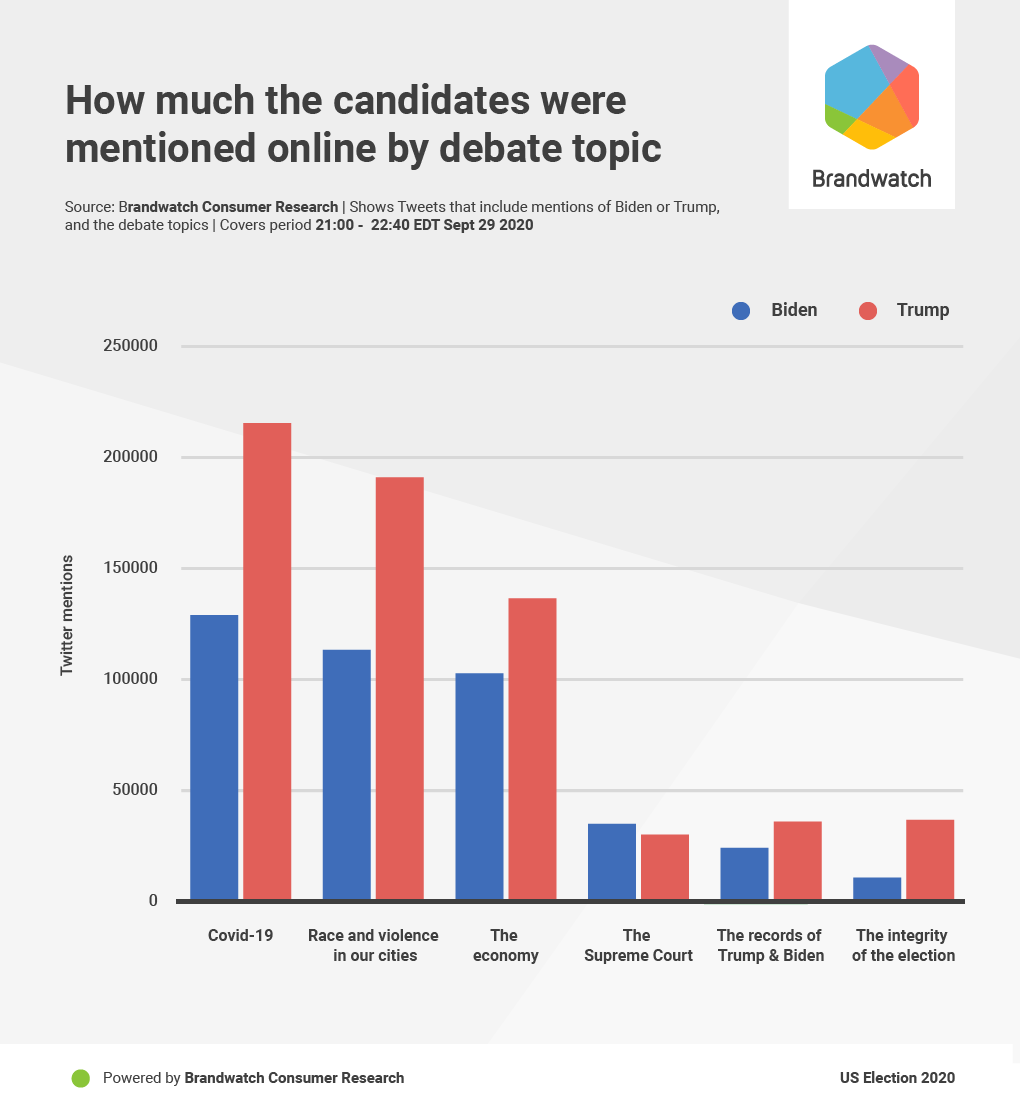
Topics of the debate

The presidential debates are a big deal. Not only do they test the candidates’ mental acuity and allow them to present their platforms, they’re also widely watched. Our survey found that 50% of American adults planned on watching the debates in some form, including clips and highlights.

In other words, America is watching.

But with the first debate done and dusted, do these face-offs change minds?

We found that 27% of likely voters who planned to watch the debates, including clips and highlights, have been waiting for them to make a final decision. This shows how much is at stake – not only do candidates need to impress undecided voters, but also people who are likely to support them.

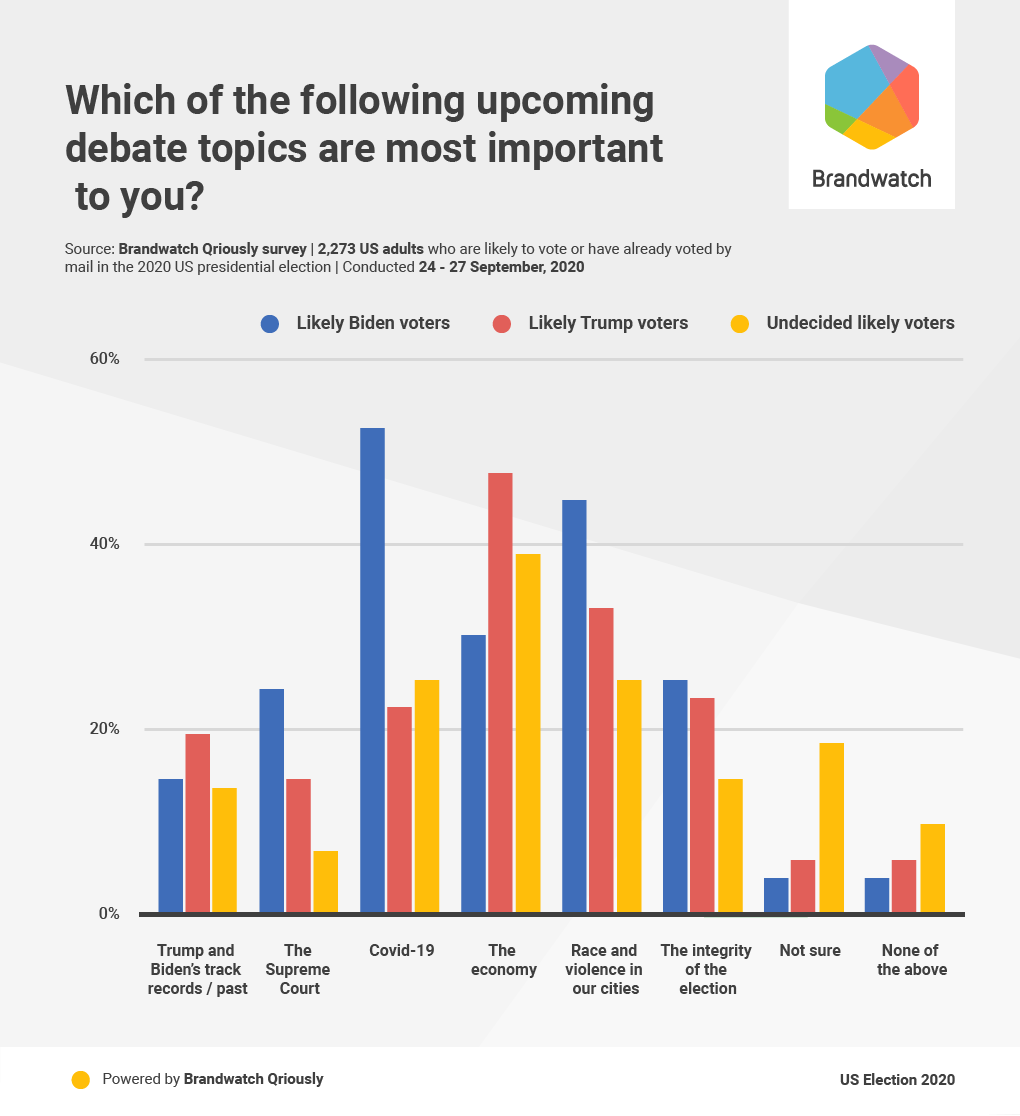
With the first debate’s topics announced in advance, we asked people which issues were most important to them (using the same wording as the moderator Chris Wallace).

Covid-19, the economy, and “race and violence in our cities” come out way ahead for both the average American and for likely voters.

Despite the recent death of Supreme Court Justice Ruth Bader Ginsburg, the Supreme Court is not cited by many as a key topic. The same is true for the track records of both candidates.

Let’s take a closer look by splitting out our results by Trump, Biden, and undecided voters.

There is some clear divergence on the issues here. The biggest issue for likely Biden voters is Covid-19, while for Trump’s it’s the economy. Both groups cited “race and violence in our cities” as the second most important issue.

For undecided voters, the economy is the most important issue. As this is something they share with likely Trump voters, this may give him a little more opportunity to gain ground. Nevertheless, their next two important issues are Covid-19, and “race and violence in our cities”, suggesting both candidates will have scope to bring these undecided voters onside.

Now that we’re post-debate, were the issues reported as most important given a lot of attention?

Very much so. Our Consumer Research platform found that Covid-19, “race and violence in our cities”, and the economy were by far the most mentioned chosen debate topics on Twitter in relation to the candidates.

With Covid-19 up top and the economy coming third, this suggests Biden voters got more of what they were looking for than Trump voters.

We should note that these mentions were mostly negative, attacking the candidate for their stance or record on the topic. This means that while Trump got the most Twitter attention, he was also the most criticized candidate.

New justices and new states

While Americans were more interested in hearing about other topics in last night’s debate, the Supreme Court has been a big topic of discussion over the last month due to the death of Ruth Bader Ginsburg.

According to Brandwatch Consumer Research, from September 1 to 17 2020, the Supreme Court was mentioned online by 110k unique authors in the US. From September 18, when Ginsburg died, to today, that number jumped to 552k.

People were asking if it was right to appoint a replacement in an election year, whether the number of justices should be increased, and if they should have term limits rather than serving for life.

With that in mind, we asked our respondents what they thought.

No one answer gets a majority, with “not sure” being the most popular choice. But the results do suggest that a large portion of people think a president should be allowed to appoint a new Supreme Court justice in an election year. This is clear when support for the options “whenever” and “only if a party is in control of the Senate” are combined.

Here’s how things shape up when we split by a respondent’s chosen candidate.

Considering the circumstances, the issue is unsurprisingly polarized.

Likely Trump supporters back election-year appointments, while Biden supporters are against them. It’s worth pondering how this data would look in 2016 when the roles were completely reversed and President Obama moved to nominate Merrick Garland to replace Supreme Court Justice Antonin Scalia.

Along with surveying Americans about Supreme Court issues, we also asked them about statehood for Washington, DC and Puerto Rico. The latter is something Democrats have been entertaining recently.

Here’s what our likely voters thought.

Giving Supreme Court justices term limits has both the most support and least opposition. While the idea is more popular among Biden voters (52% agree), 42% of Trump voters also agree, showing there’s broad support.

There was also some consensus on opposing the idea of appointing more than nine Supreme Court justices. 48% of Trump voters disagreed with the idea, with 42% of Biden voters thinking the same.

While this would enable Biden to shift the balance of the court (if he’s elected and Trump gets his nominee accepted), it’s unlikely to find much support amongst his likely voters – just 23% agree it’s a good idea.

On the subject of statehood for Washington, DC and Puerto Rico, Biden voters are in favor with 55% supporting the idea, while 45% of Trump voters oppose it. It’s not an issue Biden could win the election on, but it’s clearly popular with his base. We’ll have to see if either candidate wants to bring attention to it.

Keep your finger on the world’s pulse

Want data covering more than just the election?

Every Monday and Friday we send out our Brandwatch Bulletin, giving you data and analysis on current events, consumer trends, and everything in between.

Sign up for the Brandwatch Bulletin here.

Thanks for reading

That’s it for this week. If you want to get our bulletins every Wednesday, sign up here.

Stay safe,

Brandwatch React

Data and methodology

Detailed tables and raw data are published here. Data is released under the Open Data Commons Attribution License (ODC-By) v1.0. If you are publishing or using this data you must give attribution to Brandwatch Qriously.

Brandwatch Qriously uses river sampling and delivers market research questions to respondents via ads on mobile device apps. The proportion of respondents recruited in a particular app is determined by the demographic of its users, which allows for the collection of representative samples. There are no incentives, meaning participants are more likely to provide candid and accurate responses. Qriously has successfully predicted nine major elections. It offers an accurate, fast, and reliable way to conduct market research, even within hard-to-reach groups and countries.

About the poll: 3,384 adults aged 18+ nationwide were surveyed from 24 September – 27 September 2020. The size of the subsample of likely voters was 2,273. Data was weighted to be nationally representative in terms of age, gender, education, race, geographical region (census division), and NCHS urban/rural community type, using data from the Census Bureau’s American Community Survey (ACS), as well as 2016 Presidential election vote (or non-vote). Targets for 2016 vote were calculated using results from the Federal Election Commission, population totals from ACS and mortality data from the National Centre for Health Statistics. The margin of error at the 95% confidence level, taking into account the effect of weighting, is +/- 2.2 percentage points for estimates from the full sample. For the subsample of likely voters it is +/- 2.6 percentage points. Sampling error can be larger for subsets of these samples. In addition to sampling error, all polls are subject to a range of other potential sources of error. When percentages do not sum to 100% this is due to the effect of rounding.

logo
  Our Suite     Use Cases     Industries     Get started  

Runtime Collective Limited (trading as Brandwatch). English company number 3898053
New York | Boston | Chicago | Austin | Toronto | Brighton | London | Copenhagen | Berlin | Stuttgart | Frankfurt | Paris | Madrid | Budapest | Sofia | Chennai | Singapore | Sydney | Melbourne

Privacy Policy

Update subscription preferences

Unsubscribe

We value your privacy

We use cookies and similar technologies to personalize ads and content (including by sharing data with Google), to measure site performance, and to improve your experience. Learn more in our cookie policy

Privacy & Safety • Terms of Service

No, take me to settings
Yes, I agree
More info.

By using our site you agree to our use of cookies —