5 times non-sponsor brands shined during this football summer
By Ksenia NewtonJul 16
Explore the live data behind football’s biggest global tournament.
To gain the attention of your colleagues, data needs to be engaging and impactful. Here are four steps to help optimize your storytelling with data.
We can tell powerful stories with data. We can create a dialogue that transcends different languages. We have been doing this for thousands of years and there is no end in sight.
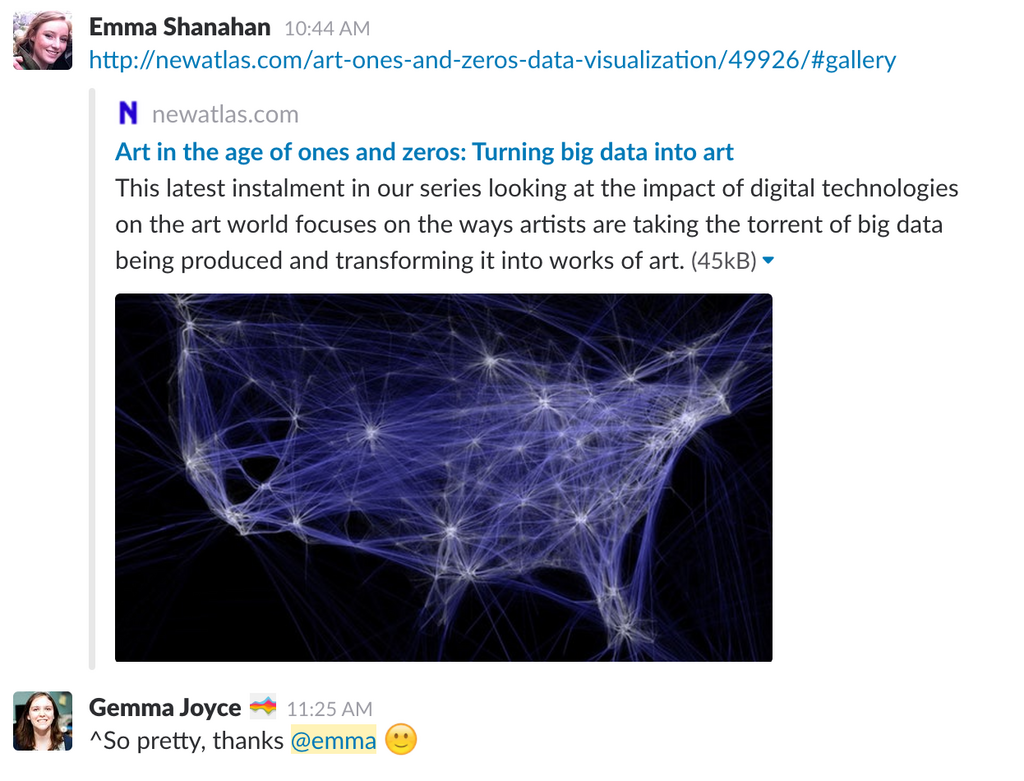
Here at Brandwatch, we’re big fans of data visualization in all shapes and forms.
We use it to inspire…
 We use it to educate…
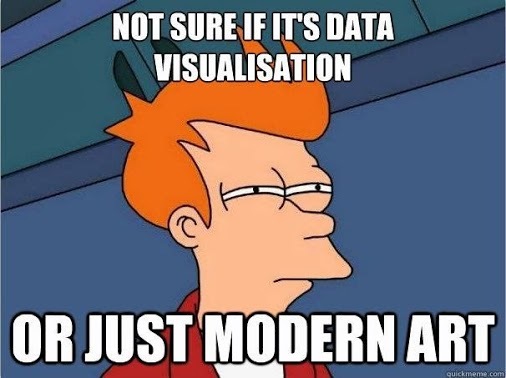
We use it to entertain…
Weird data: We took a look at the people behind the #FlatEarth movement: https://t.co/BeZNJfKiJj pic.twitter.com/QdiCWgKhaj
— Brandwatch React (@BW_React) August 19, 2017
Our data visualization and distribution product, Vizia, is strategically placed in different locations in our offices so we’re always passively and proactively ingesting data pertinent to our department or location.
But to gain the attention of hundreds of busy and hard working people, that data needs to be engaging and impactful. It needs to tell a story and to tell a story, it needs to be curated.
When data has been described as ‘the oil of the 21st century’, any forward-thinking marketer or analyst will want to master the art of curation.
Bearing that in mind, we’ve put together a 4-step guide to help you create insightful and memorable data visualizations.
Who is this visualization for? Where will they see it? What data are they interested in? How will this help the reader?
 If you already know the answers to these questions, great. If not, time to lock in the answers.
Once you are clear on the audience and the setting, turn your attention to the data.
The need for data visualization generally stems from the need to organize the set into digestible portions. Take your data, whether it be marketing, sales or quantitative research, and decide on the facets and aspects that are most pertinent to the end goal. Eliminate anything that diverts from the point.
Throughout the entire process, keep on asking yourself ‘how will the reader benefit from this?’ and allow that to guide you.
Just remember, you want to inspire action with your data so make sure that everything is labeled correctly and that the correct data is being displayed.
This step is integral to the success of your visualization. It’s time to organize and categorize your data into different building blocks. Think of it like chapters in a book – they must be in an ordered and sensical sequence to engage the reader.
Essentially, you want to do most of the work for the reader so that they spend less time interpreting and more time taking action.
For instance, if you’re working on a marketing dashboard, you might want to start with an overview of brand health online, the top sources for conversation and the influencers in the audience.
Once that’s been established give a snapshot of the competitive landscape, the presence of the main players, the share of voice and maybe some successful competitive campaigns.
Finally, it would be good to understand how these activities are affecting your goals and performance. By integrating website session data and Google Analytics data it gives an end-to-end perspective on the brand performance online.
How will the data look? It’s important to decide on how you’re going to represent the information in your visualization.
This will depend entirely on the data at hand. Most quantitative data is better displayed in graph format, but you still must determine whether a spline graph or a bar chart will do the data more justice.
Some common types of data visualization include:
You can find an extensive list here.
Needless to say, the format of the visualizations will depend on the data at hand. And It doesn’t end here.
You must consider how these charts and visuals will work together to deliver the greatest impact. Three pie graphs side by side show the data in the most efficient way but is it the most effective way of informing and educating the reader?
Again, ask yourself: ‘how will the reader benefit from this?’
Last but not least, you must decide on the packaging for your hard work. What’s the best medium for communicating your insights?
Given the countless number of data visualization tools available, you’ve no reason not to get started storytelling with data.
If you’re interested in a more robust and dynamic offering, find out how The Vizia 2 Platform can help you bring your data to life seamlessly across the enterprise.
Bring your social and marketing insights to life across your organization

Existing customer?Log in to access your existing Falcon products and data via the login menu on the top right of the page.New customer?You'll find the former Falcon products under 'Social Media Management' if you go to 'Our Suite' in the navigation.
Brandwatch acquired Paladin in March 2022. It's now called Influence, which is part of Brandwatch's Social Media Management solution.Want to access your Paladin account?Use the login menu at the top right corner.