10 Social Listening Tools and Who They’re Best for
By BrandwatchJul 14
Join us and boost your social media potential with our data-led event
The other day I saw someone asking for advice on what were considered to be the ‘most important’ data visualisations in social media monitoring. This struck me as a bit of a strange question, so I decided to write a bit about it.
If you were hoping to see a clear cut list of 5, I’m afraid you will be disappointed. I chose the title because it is the sort of claim often made in digital and social media marketing: not only do people love top 5s, but they love graphics even more.
Unfortunately though, there are no social media monitoring charts, graphs or visuals that are universally ‘most important’. The reality, as is often the way, is that it depends.
The Most Common
We could certainly do a top 5 of the most common graphs that we see in reports, case studies and infographics, but these are not at all necessarily the most important ones. Generally, they are only very top-level and provide just a snapshot of the data in question.
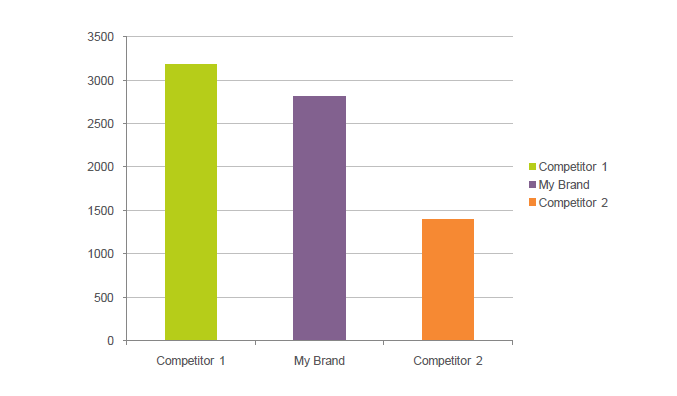
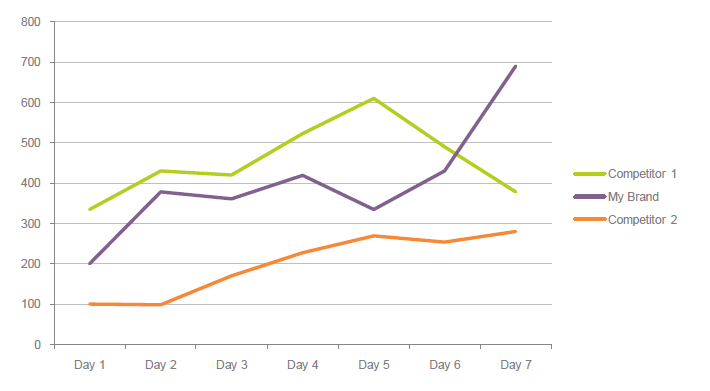
These might include comparisons of one brand or topic against others, either over time in a static bar chart or over time in a line graph:
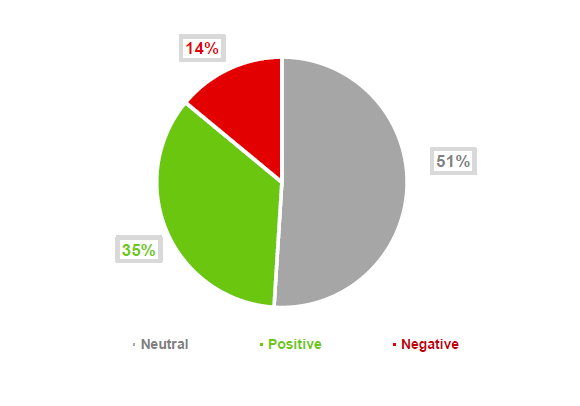
Also common are pie-charts showing a breakdown of either sentiment (positive/negative/neutral) or sources/page-types (e.g. blogs, forums, Twitter and so on):

The Most Important?
However, when it comes to which ones are the most important, it depends entirely on what needs to be achieved with social media monitoring. Tools like Brandwatch can go way beyond the above examples and drill down into much more specific areas. There are countless ways to display data when doing this, depending on what’s most important to the overall objectives and purposes for monitoring social media – here are just a couple of examples.
Topics
When conducting brand-centric research, it might be important to find out what the most common topics of discussion in relation to the brand are. To illustrate how this could be done in an automated way, I ran a query for the Volvo XC90, looking at data from the past month. Then, I ran several queries within that data (we call these ‘recurring phrases‘) to see which of the topics I’m interested in were talked about most:

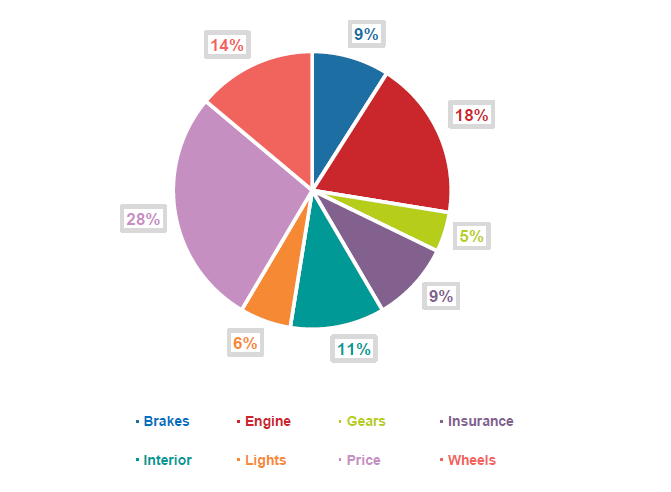
So, I’m looking at a month of data for the Volvo XC90 and I can see that there were 418 mentions found about brakes. This may well be interesting, but it isn’t that much use on its own – I might want to find out why people are talking about this topic or what they are saying about it. I could of course do this manually and run through each mention individually – this can often be the most precise approach, but if there’s a lot of data it may simply not be feasible.
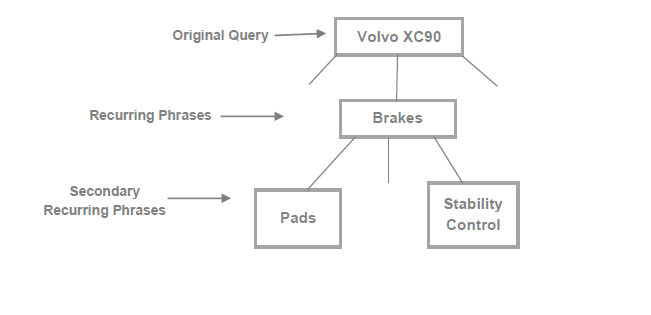
A handy aspect of Brandwatch’s recurring phrases feature is that it allows you to drill-down a level further. So, in this case I’m looking at ‘brakes’ within the XC90 data, and I can click through to see a recurring phrase cloud for this data to see which are the most common phrases associated with the 418 mentions of brakes found within the XC90 data:
Influence
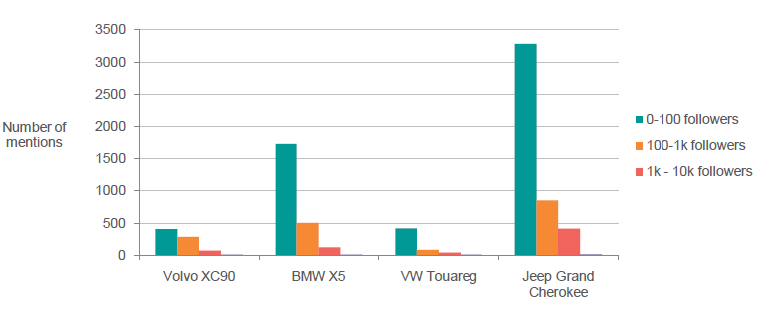
Alternatively, the research being conducted might be looking at the whole market, with the view to understanding how influential the people talking about the brand and its competitors are. To demonstrate one way of doing this, I ran queries for three of the XC90’s competitors. I went to each query and filtered by different levels of Twitter followers to see how many mentions came from which range for each brand. The below shows us that most Twitter mentions of all the brands come from users with 0-100 followers – if we want to find only the more influential mentions on Twitter, we might want to filter these out.
These are just two examples – whether they are of any use or interest depends on both the objectives of the particular social media monitoring process and the actual data itself. The fundamental point is that there are endless ways to look at data and which is the most important depends entirely on what the user wants to know.
The above examples are all made using a combination of Brandwatch and its export-to-Excel functions. For a free trial of Brandwatch please register for a demo and one of our team will be in touch.
Offering up analysis and data on everything from the events of the day to the latest consumer trends. Subscribe to keep your finger on the world’s pulse.
Consumer Research gives you access to deep consumer insights from 100 million online sources and over 1.4 trillion posts.
Existing customer?Log in to access your existing Falcon products and data via the login menu on the top right of the page.New customer?You'll find the former Falcon products under 'Social Media Management' if you go to 'Our Suite' in the navigation.
Brandwatch acquired Paladin in March 2022. It's now called Influence, which is part of Brandwatch's Social Media Management solution.Want to access your Paladin account?Use the login menu at the top right corner.
