⚽ Football Attention Index: Live Analysis ⚽
Explore the live data behind football’s biggest global tournament.
Explore live data
Explore the live data behind football’s biggest global tournament.
When it comes to understanding consumers, businesses choose Brandwatch ahead of any other tool.
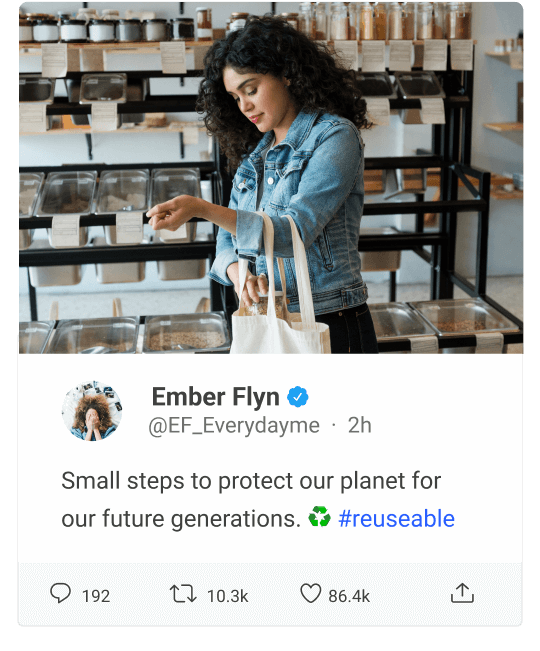
Collect millions of posts, comments, and conversations that are relevant to you.
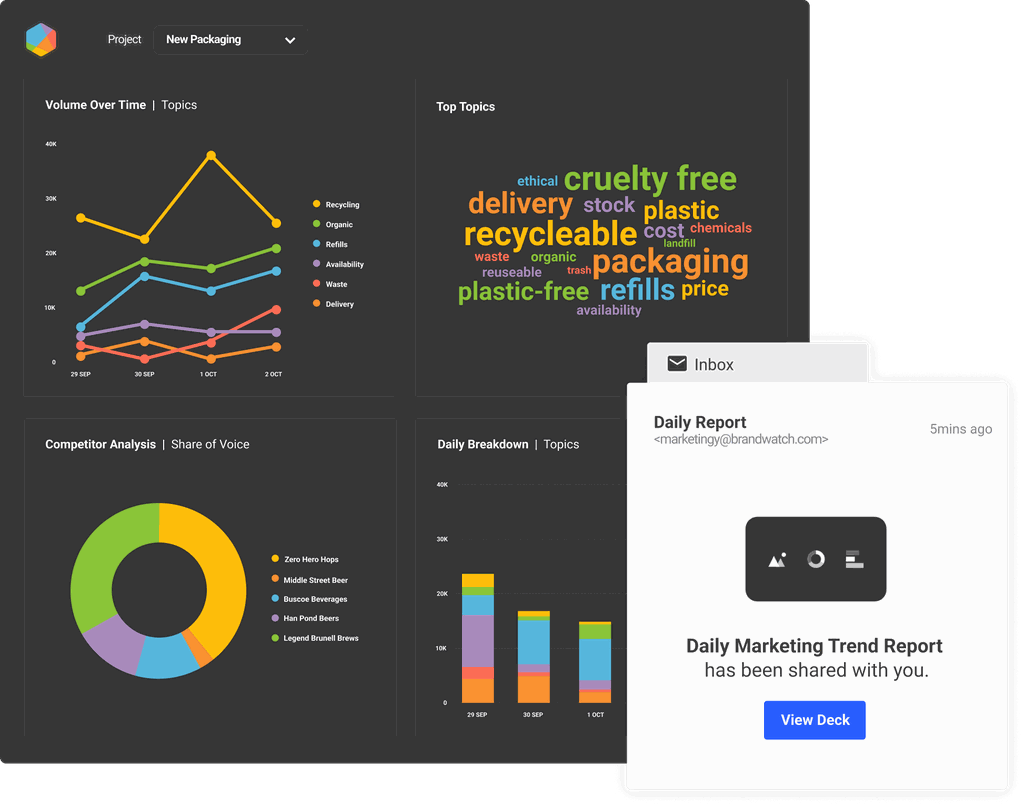
Categorize conversations by feedback, complaints, opinions, and more.

Use AI to spot insights and answer your questions.
Share insights across your organization with alerts and live reports.
Only Brandwatch provides the most historical and real-time consumer data.
1.7 trillion historical conversations back to 2010
501 million new conversations added every day
Official firehose access to Twitter, and Tumblr
Conversations from 100 million unique sites and billions of sources
Only Brandwatch has spent 17+ years developing industry-leading AI combining large language models with proprietary technology.
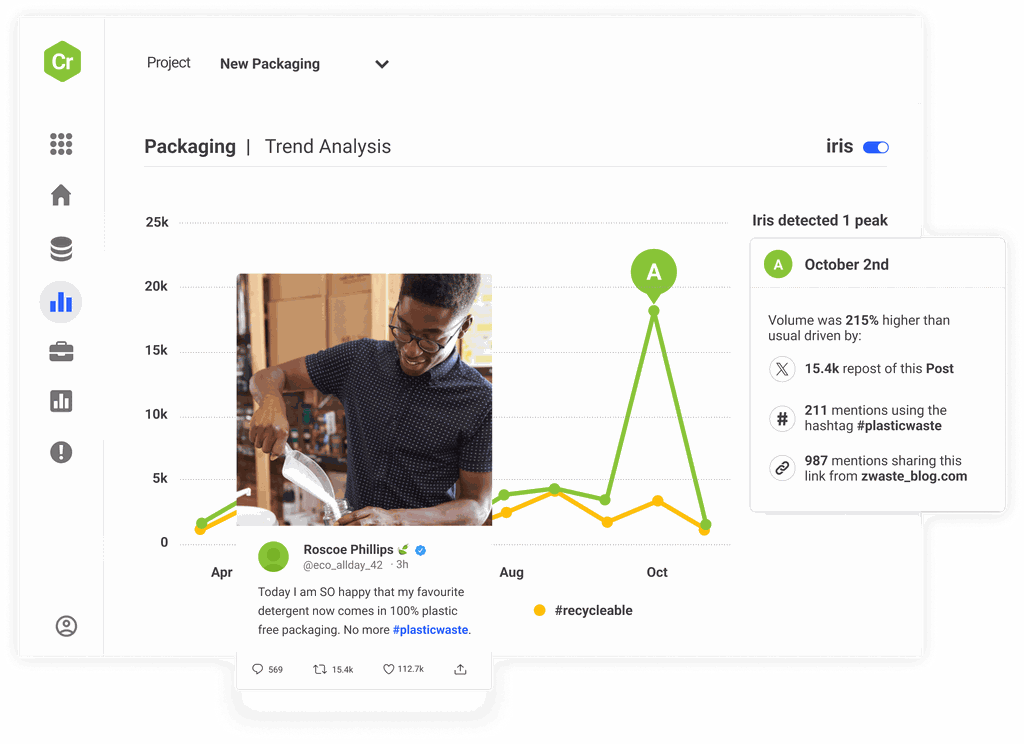
Iris, your AI assistant, turns data into human-readable insights instantly
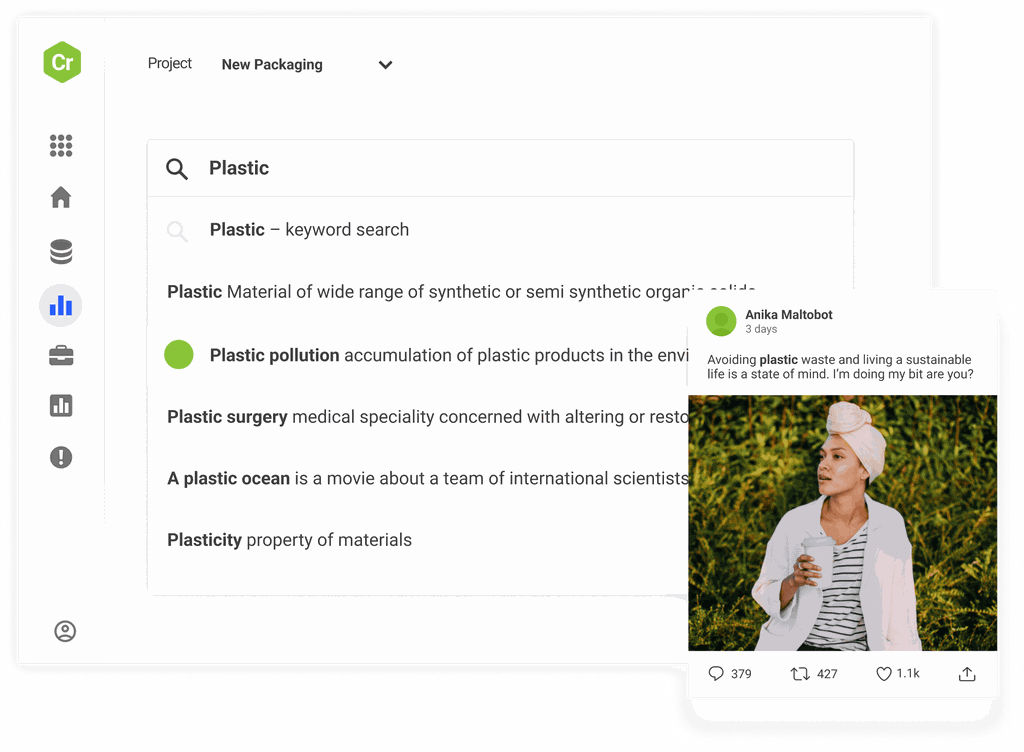
Image analysis uncovers the objects, scenes, actions, and logos in every image
Machine learning classifiers automatically segment data to fit your needs
Allowing anyone to instantly find relevant data on any brand or topic
Only Brandwatch gives you the speed and flexibility to craft compelling data stories at this scale.
Flexible UI can be combined in thousands of ways to find any insight
Choose from 50+ live visualizations to analyze data
Upload your own data to spot sentiment, key topics, and historical trends
Analyze vast data sets and overlay custom audiences of millions at speed
Only Brandwatch combines all this with the tools to create a data-driven culture in your organization.
Instantly share insights via Excel, PPT, PDF, or via the Brandwatch API
Set up automated AI-powered email alerts to key stakeholders in your business
Send live data to any screen across your organization with Vizia
Measure how many people view, engage with, and rate your reports with Vizia
Consumer Research forms the basis of Brandwatch's consumer intelligence solution, with add-on apps providing enhanced functionality for specific use cases.


Curious about how Brandwatch can help you better understand and engage with your audience?Discover the power of our social suite with a product demo.
Existing customer?Log in to access your existing Falcon products and data via the login menu on the top right of the page.New customer?You'll find the former Falcon products under 'Social Media Management' if you go to 'Our Suite' in the navigation.
Brandwatch acquired Paladin in March 2022. It's now called Influence, which is part of Brandwatch's Social Media Management solution.Want to access your Paladin account?Use the login menu at the top right corner.