


18 Social Media Holidays to Celebrate This August
By Yasmin PierreJul 6
Explore the live data behind football’s biggest global tournament.
We take you on a journey from cave paintings to now, looking at how the evolution of the data visualization has touched every part of our history
Data. Data. Data.
It’s all around us. Essentially, everything we do or say can be regarded as a data point, and it’s not going to stop anytime soon.
With so much data in the world, how can we possibly interpret it effectively and efficiently?
Alas, we’re not the first to ask that question; for thousands of years, people have been wondering how to make sense of the information around them. We have them to thank for the power of modern data visualization.
Early iterations of data visualizations date prehistory.
Think hunting manuals drawn on cave walls and supposed handbooks to the spiritual afterworld.
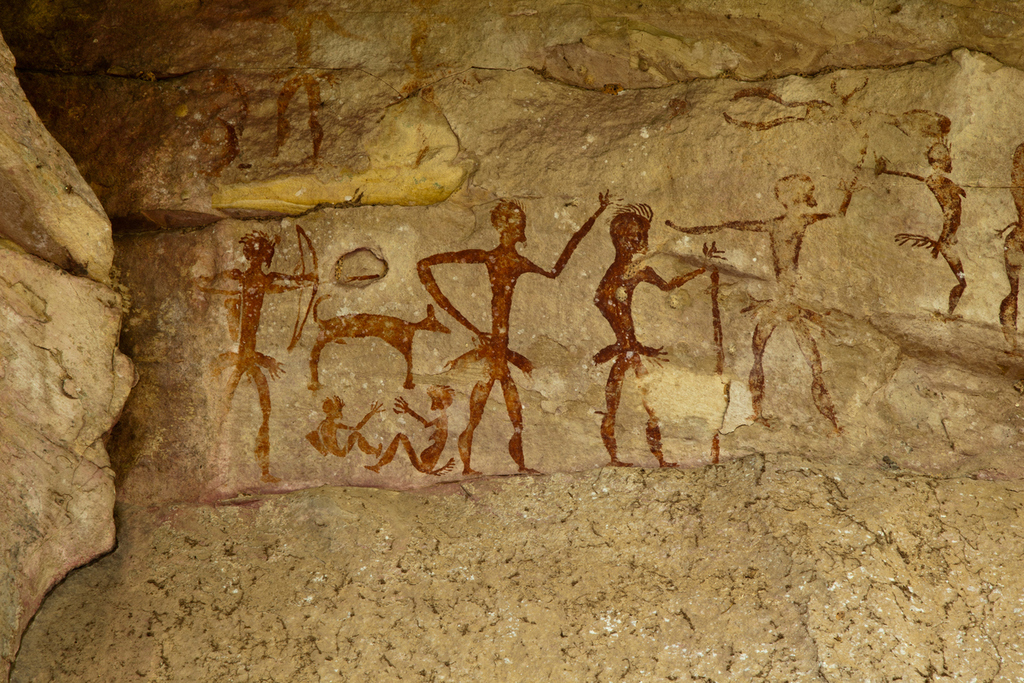 These drawings were used as how-to guides for interpreting and surviving the world, which, in a sense, maintains true of data visualizations today.
As our civilization advanced, so did data communication.
The ancient Greeks and Egyptians excelled in the space, charting the constellations and movements of the sun. The very first examples of modern science preserved in clay for centuries to come.
One of the most obvious examples of data visualization is maps, an asset we would literally be lost without.
In Roman times, maps were used to understand and plan the movements of armies.
Competitive strategies were born from these maps, and are probably to thank for the great empires of the time.
It wasn’t until 1570 in Belgium that the first recognizable map of the world was released by Abraham Ortelius. In fact, Ortelius released an entire atlas complete with 53 maps, in the first attempt to gather all known records of world cartography.
Enter the 18th century when there was a lot going on. The French Revolution, the colonization of the Americas, the beginning of the industrial revolution.
But towards the latter half of the century, an English theologian was working on possibly one of the most impressive data visualizations of all time.
Introducing Joseph Priestley’s Chart of Biography. An incredible timeline of events that organized several centuries of history.
Depicting the rise and fall of empires, prominent figures and major moments in history in thousands of data points.
For the first time ever, lines were used to donate the duration of an individual’s life. Priestley changed the game.

There is a magic in graphs. The profile of a curve reveals in a flash a whole situation — the life history of an epidemic, a panic, or an era of prosperity. The curve informs the mind, awakens the imagination, convinces.
When it comes to conveying the horrors of war, one data visualization will triumph above all others.
50 years after Napoleon’s tragic March on Moscow, Charles Minard set out to portray the colossal loss of life with one relatively simple data visualization.
 Even though Minard has included six different types of information, it is easy to discern that the plummeting temperature was the ultimate downfall for the army – depicted as a simple time below the viz.
The flow of men, gold (outward) and black (returning) stands as a reminder of the true cost of war.
The ways in which we can portray data have advanced hugely, think infographics and network graphs, command centers and war rooms.
The internet and digital media have allowed for a free flow of information and ideas, meaning it is easier than ever to learn from others.
 New ways of presenting data cater for instant insight that can be distributed anywhere in the world.
Knowledge is power, but an overload of information can be suffocating.
With the onset of big data and the democratization of data visualization, it is important that executives and analysts alike have the power to pick and choose the information that is pertinent to them.
At Brandwatch we want to help others achieve this. Find out how the Vizia 2 Platform is powering informed and intelligent decision making in some of the biggest brands in the world. Or you can check out this list of data visualization tools you can use to create your own.
Consumer Research gives you access to deep consumer insights from 100 million online sources and over 1.4 trillion posts.
Existing customer?Log in to access your existing Falcon products and data via the login menu on the top right of the page.New customer?You'll find the former Falcon products under 'Social Media Management' if you go to 'Our Suite' in the navigation.
Brandwatch acquired Paladin in March 2022. It's now called Influence, which is part of Brandwatch's Social Media Management solution.Want to access your Paladin account?Use the login menu at the top right corner.