


Brandwatch Named a Leader in IDC MarketScape for Social Marketing Software for Large Enterprises
By Matt TippetsNov 22 2024
Explore the live data behind football’s biggest global tournament.
Tired of spending time and resource on regular reporting? We've just launched Automated Reports. You'll never look back.
Ah, reporting. We’re all familiar with putting together regular reports on our social (hopefully) success. Regular reporting on your social data allows you to better evaluate how your brand and social activities are performing, helping you to better prove the ROI of all that hard work.
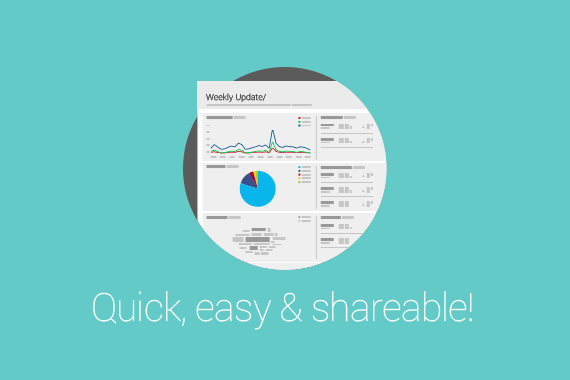
But we all know that putting together daily, weekly or even monthly reports can be a laborious task. That’s why today we’re launching Automated Reports.
Automated Reports take all of the pain out of regular reporting, saving you precious time and making getting an overview of your data and sharing it with others easy.
No longer do you need to copy and paste charts or spend an age in Excel – Automated Reports gives you attractive templated reports automatically. You just tell it how often you want to receive them and voilà, there they are in your inbox on the desired days.
They can be set up in just a few clicks, then the system does all the hard work for you.
 That means you can keep tabs on your Queries and Channels, and share the data with others who may not have the time or desire to log in to the app regularly.
“Brandwatch dashboards are easy to use and are great for drilling into trends to understand what’s driving activity. No matter how easy and useful a tool is, stakeholders don’t always have the time to log in and look for data. They want bite sized summaries delivered to them in an easy to consume format and that’s where automated reporting comes in.” – Malcolm McGeachy, Channel Development Team, Sky
Automated Reports are perfect for:
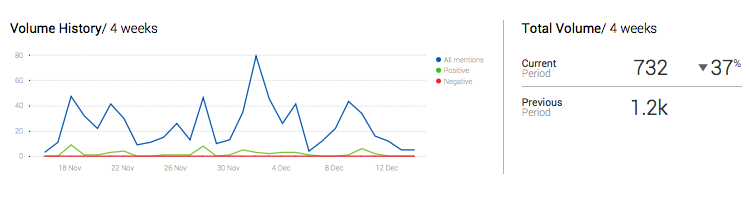
There are three templates to choose from, each with a range of charts and tables displaying important metrics for your data:
All of the templates also include change numbers comparing the period to the previous, so you can see how the numbers are changing over time, and can be delivered as regularly as you need – daily, weekly, fortnightly, monthly or quarterly.
Plus, they’re sent to your inbox in html and PDF format, so that you can then share them with others – even those without a Brandwatch login.
We started developing an automated reporting feature after requests from clients who were looking for an automated way of sharing data in a report format.
Converting our incredibly flexible dashboards into a PDF format was complex – check out the blog tomorrow when our VPE Product Strategy, Glenn White, will be talking about the various challenges, successes and failures along the way!
Automated Reports goes a long way towards making sharing Brandwatch insights much quicker, easier and automated.
However, we’re not just stopping here. Over the coming months we will be adding to Automated Reports, including adding new templates and some other functionality such as adding other recipients and getting instant reports. In the future our vision is to build a fully customisable report builder, that allows you to recreate your dashboards in report form.
“Given the depth of the data visualisation tools already in Brandwatch, beginning to offer customised automated sharable reporting that can shoot out to clients or internal groups is precisely what we needed. Usually we have multiple levels of reporting internally for Account Managers, Subject Matter Experts, and Analysts, so we need a flexibility there from birds-eye-view to granular break-outs depending which group internally needs that information. I’m very much looking forward to how the reports develop as we move forward.” – Brandon Schakola | Group Director, Earned Media, The Search Agency, Inc
What exactly we add will depend on your feedback – so please do let us know, through whichever avenue you like – whether that’s through our support team, on our social channels or via your Account Manager. We want to hear from you!
If you’re already a Brandwatch Analytics user, you can get started straight away – just look for Reports in the left hand sidebar menu within the app and start setting up your Reports instantly.
They’re simple to set up, but if you need some help or more information, take a look at our Help Center guide.
Consumer Research gives you access to deep consumer insights from 100 million online sources and over 1.4 trillion posts.
By Matt TippetsNov 22 2024
By Matt TippetsNov 21 2024
Existing customer?Log in to access your existing Falcon products and data via the login menu on the top right of the page.New customer?You'll find the former Falcon products under 'Social Media Management' if you go to 'Our Suite' in the navigation.
Brandwatch acquired Paladin in March 2022. It's now called Influence, which is part of Brandwatch's Social Media Management solution.Want to access your Paladin account?Use the login menu at the top right corner.