


5 times non-sponsor brands shined during this football summer
By Ksenia NewtonJul 16
Explore the live data behind football’s biggest global tournament.
Using social media metrics to measure success requires a targeted approach: linking metrics to goals will demonstrate value and drive real world action.
The value of social media metrics has been debated virtually since social analytics was taking its first steps.
Despite this, there is a library’s worth of blog posts that will give a definitive list of ‘the social media metrics that matter’.
While it may be desirable to find a guide that claims to give you all the answers, particularly if you are fairly inexperienced with social analytics, the truth is that what you should measure depends on what your goals are.
Social media metrics are not the end goal, they are the starting point. It’s not simply the case that “if X metrics are high, you are succeeding”.
 Ultimately, the metrics you choose to monitor should drive action. And that action should help move users along the sales funnel and towards being a customer.
One metric will rarely tell the whole story. Often you will need to examine a combination of metrics.
Social media may be driving loads of traffic to your site, but other metrics might reveal that this type of traffic rarely converts. If this is a problem you should optimize your content or call to action, but it might be part of a bigger strategy to increase brand awareness.
If this is the case, other metrics will tell you if your reach is growing.
Vanity metrics has been a hot topic of late, but the truth is almost anything can be a vanity metric if it is measurement for measurements’ sake.
You will often see RTs listed as a vanity metric, but if a piece of content is targeted at social media, and exists primarily to drive brand awareness, then RTs will spread the content further and is a valid metric to track.
Similarly, some people don’t like follower counts, but if your follower count goes up dramatically during a particular campaign, for example a Twitter chat or while you are live tweeting an event, that informs you that that campaign is a valuable strategy for growing your audience (which in turn will get your content in front of more people).
As the ultimate aim is to move people along the sales funnel, you will probably need multiple tools to fully understand and measure your social media metrics.
The purely social metrics can be gained with a tool like Brandwatch, and your email automation software will provide the metrics associated with your emails.
You then want to transfer to Google Analytics to understand how those metrics are driving people to your site, how those people are consuming your content, and how many of them are converting.
So once you’ve taken all that into consideration, assess your goals for each campaign. Once you have worked out what you want to achieve, go through the list of metrics below and work out which combination of those will provide a benchmark for your goals, and get tracking.
Followers – the people who will be regularly exposed to your posts and content
Reach – the number of individuals who have seen your content
Impressions – the potential number of times your content was seen (not the number of times it was actually seen). This could include the same person seeing it twice if it reappears in their timeline/feed
Sentiment – when tracking online conversations, social intelligence tools use natural language processing to segment negative and positive statements
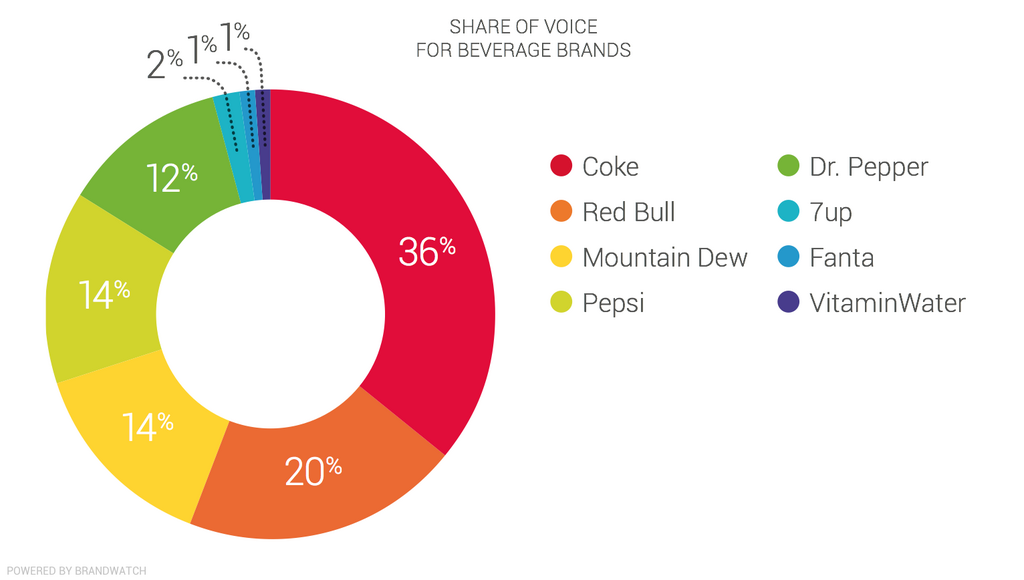
Share of Voice – by tracking the social conversation around your brand and your competitors, you can calculate the percentage of audience conversation focused on your brand
 Engagement metrics
Channels tell you how people arrived at your website. You will find this breakdown in your Google Analytics account.
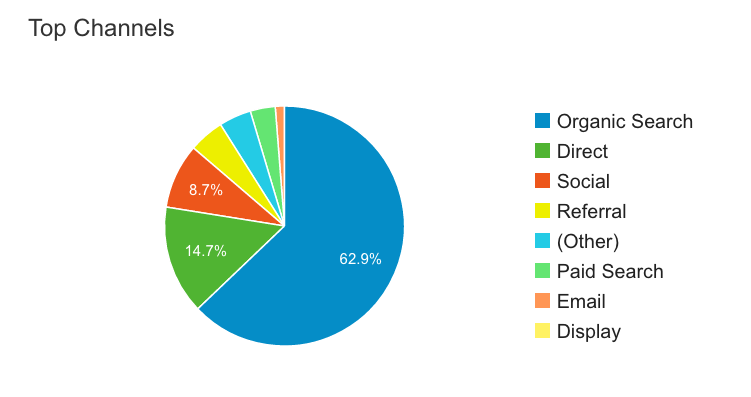 Organic search – People coming to your site via a search engine
Direct – you can’t tell exactly the route they have taken, but this includes typing the URL into the address bar, clicking on an email link or arriving via a bookmark
Social – people coming to your site after clicking a link on social
Referral – someone who came to your site from a different website, but outside of a search engine
Paid search – people who have clicked on one of your adverts on a search engine results page
Email – only counts the emails you have sent out
Display – people who have clicked on banner adverts.
Page views – how many times someone accessed a particular piece of content on your site
Users – Page view numbers can be affected by repeated visitors. The number of users will tell you how many separate people viewed your content
Sessions
Average time on page – allows you to work out whether people are skim reading your content or taking the time to read and digest
Pages per session – tells you whether people browse beyond the content they first discovered. Was the content captivating enough to make them want to browse?
Bounce rate – The percentage of people who leave your site after viewing only one page
Video views – Serves the same function as page views. How many times did someone watch your video? Note that different platforms have varying rules on what constitutes a view
Email opens – How many people opened your emails and at what time? This allows you to optimize subject lines and time of day
Email clicks – Which links within your emails were the most popular?
Click through rate – How many people clicked on your advert as a percentage of people who saw one. Calculated by a simple formula: CTR = Clicks ÷ Views.
Conversions – the number of people who completed to your desired result. This may be buying a product, requesting a demo, downloading content: whatever goal you have chosen
Downloads – How many people downloaded your content?
Form Completions – For gated content, users will need to complete a form before they download. How many precious details did your content collect?
No definitive list exists of the metrics that everybody should be measuring. But by aligning metrics and goals, and a continued analysis of the numbers, insights can easily surface.
Measuring social media metrics in the right way can highlight areas of success and concern, and crucially drive actions to be taken.
Consumer Research gives you access to deep consumer insights from 100 million online sources and over 1.4 trillion posts.
Existing customer?Log in to access your existing Falcon products and data via the login menu on the top right of the page.New customer?You'll find the former Falcon products under 'Social Media Management' if you go to 'Our Suite' in the navigation.
Brandwatch acquired Paladin in March 2022. It's now called Influence, which is part of Brandwatch's Social Media Management solution.Want to access your Paladin account?Use the login menu at the top right corner.