


Brandwatch Named a Leader in IDC MarketScape for Social Marketing Software for Large Enterprises
By Matt TippetsNov 22 2024
Only 25% of marketers truly understand their audience. Do you? Join us for a candid conversation and discover the tools and skills top marketers are using in 2026.
Published February 7th 2017
It’s not just the amount of data you have, but the ability to focus on what matters that brings real insights. Today we launch the new Dashboard Wizard.
The Dashboard Wizard is a brand new interface that makes setting up reports in Analytics up to 10 times faster, opening up the best that Brandwatch has to offer to more users than ever.
As anyone who works with big data will tell you: it’s not the amount of data you have, but the ability to focus on what matters within that data that brings real insights.
Brandwatch was the first to introduce custom Rules, allowing users to slice and dice their social mentions as they come in, however they want.
By setting up custom Categories and Tags you can segment all your data into the topics and themes that are important to you.
Now, with the Dashboard Wizard, that whole process can be automated as well.
‘The Brandwatch Dashboard Wizard is an incredibly valuable tool for anyone who has ever contemplated the questions: ‘What’s the best way to visualize my social data and unlock important insights?’ and next ‘Where do I start?’
Jason Andrus – Vice President, Social Media and Brand Management – FXCM
The Wizard has already been extremely popular with our beta users, cutting the average time taken to set up a segmented Dashboard from 15 minutes to around 90 seconds.
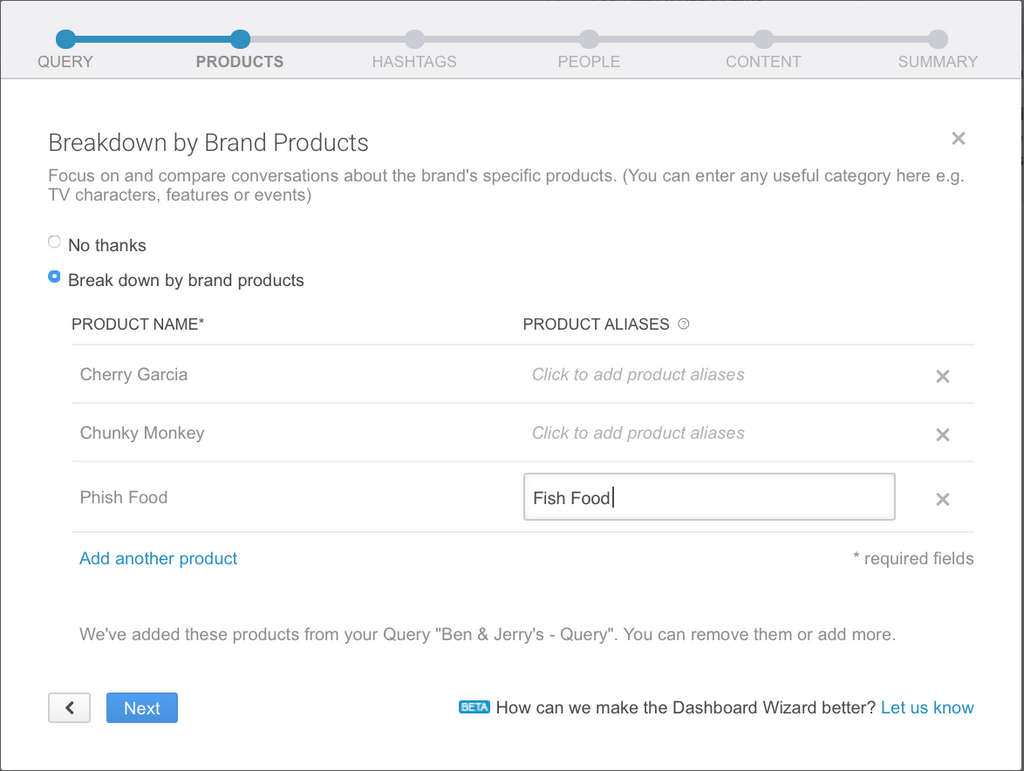
To get started, simply pick a Wizard and tell the system what you want to track and analyze by answering some simple questions in a form.
 You can choose to segment by:
As you fill in the form you may be offered some automatic suggestions based on your original Query.
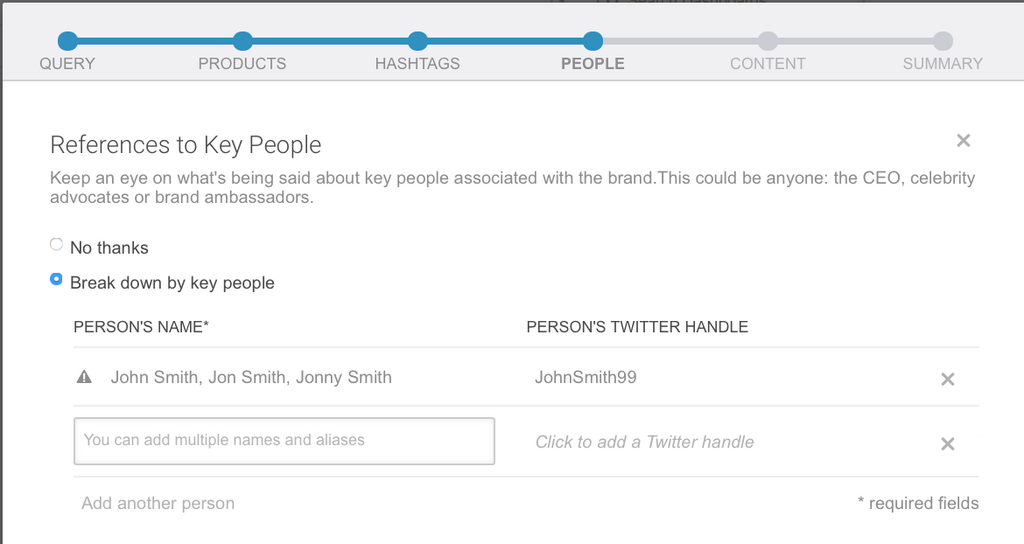 You also have the option to add aliases, handles or alternative spellings for people or product names to make your categories even smarter.
These Rules and Categories are all then built for you and a Dashboard set up, charting and filtering your data the way you need it.
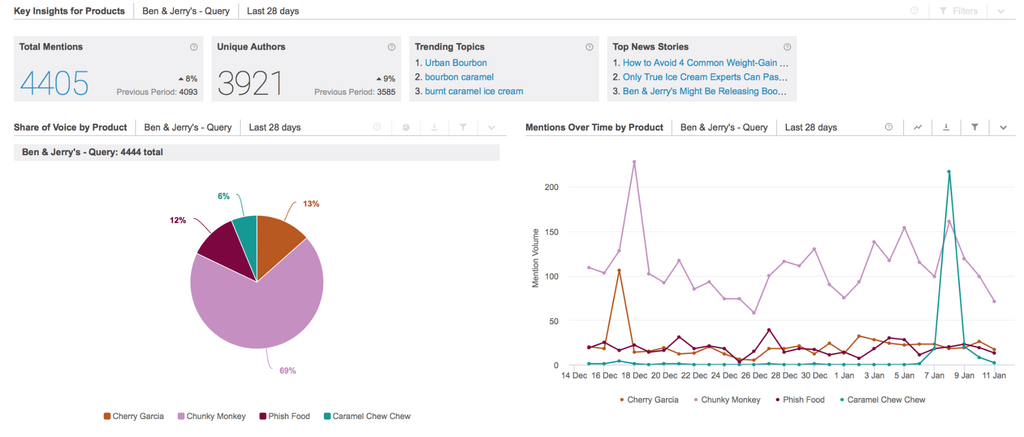 Compare the categories you’ve set up in broken down charts. Discover which products, for example, are talked about most and which have seen spikes in conversation.
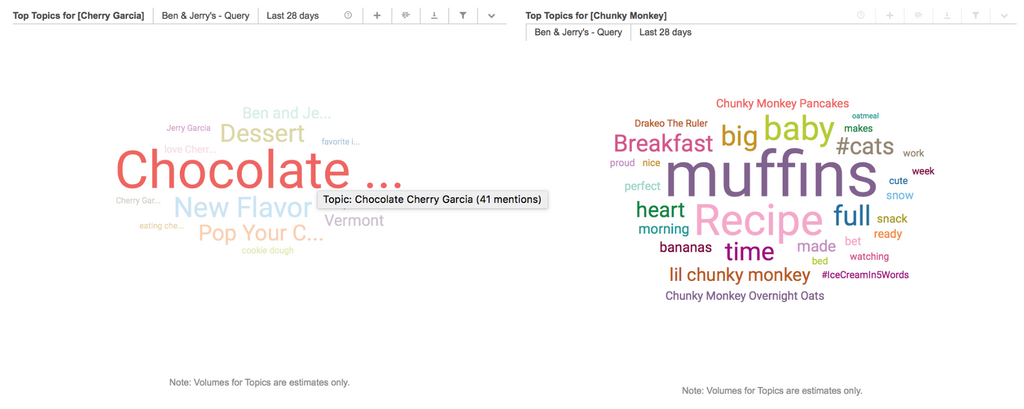 Drill down into what’s being said about each of the key topics you’ve selected.
I find the Dashboard Wizard not only a time saver but also an enabler for less advanced users to easily create searches and report on them. It both simplifies the usual query and dashboard creation process, and makes the whole approach much quicker.
Simon Burslem – Senior Digital Marketing Executive – EDF Energy
The Wizard allows less experienced users to access the full value of custom categorization.
Combining this with the Query Wizard which launched last year, now, for the first time ever, a complete beginner can set up a smart, personalized and segmented Dashboard without the need to use any boolean operators.
Teams can also work more easily on different projects together around a single source of data.
By setting up and maintaining one main brand Query for example, an analyst can then allow anyone else to easily ‘search’ within that Query and set up their own Dashboard to look at the topics that matter most to them.
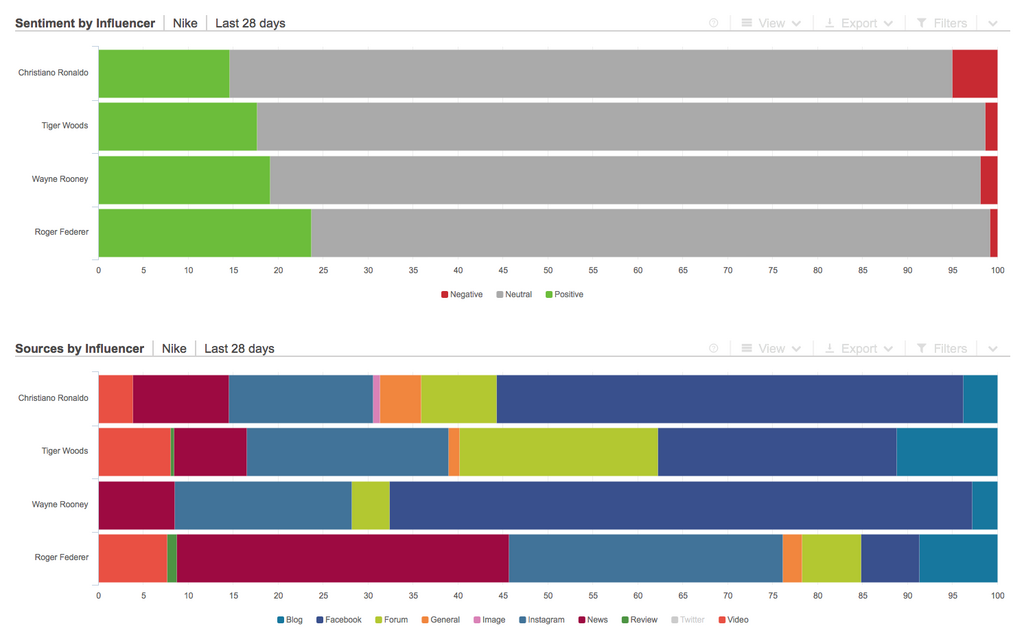 For example, an influencer marketer might use the Wizard to quickly set up a report showing which brand advocates are generating the most engagement on different sites and how their sentiment compares.
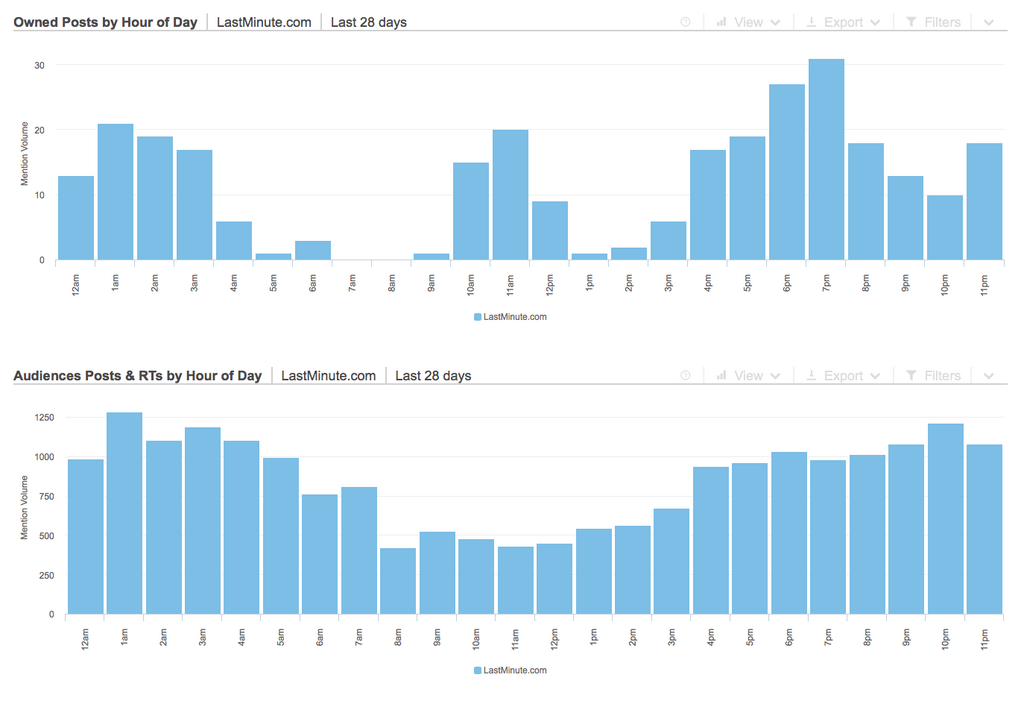 Or a community manager might want to understand what content is working best and whether they are posting at times when their audience is most active.
All of this can be done with the confidence that the original data is good and without fear that multiple collaborators could delete or edit anything important.
While I have created many custom dashboards myself in the past, the Dashboard Wizard has now become my go-to starting point and helped spark new dashboard ideas for even deeper monitoring and insights.
Jason Andrus – Vice President, Social Media and Brand Management – FXCM
Because these Dashboards are exactly the same as ones you could have made from scratch, you can still go under the hood via the ‘Tools’ tab to tweak and experiment with the Rules, Categories and Filters that have been automatically set up.
This makes the Wizard not only a time-saving device, but an excellent platform from which to start exploring and developing your analytics skills and finding inspiration for new ways to look at your data.
More to come
Brand Monitoring and Campaign Tracking are the first two Wizards we’ve built. If you have an idea for a Wizard that you’d like to see next let us know!
Consumer Research gives you access to deep consumer insights from 100 million online sources and over 1.4 trillion posts.
By Matt TippetsNov 22 2024
By Matt TippetsNov 21 2024
Existing customer?Log in to access your existing Falcon products and data via the login menu on the top right of the page.New customer?You'll find the former Falcon products under 'Social Media Management' if you go to 'Our Suite' in the navigation.
Brandwatch acquired Paladin in March 2022. It's now called Influence, which is part of Brandwatch's Social Media Management solution.Want to access your Paladin account?Use the login menu at the top right corner.