Social listening is a bit like finding a needle in a haystack, or, to be more accurate, many needles in a very big haystack.
For most brands, there are dozens or hundreds of interesting mentions relating to their brand, products, or industry every day, but the problem is that they are hidden among thousands of less interesting or completely irrelevant mentions.
The query helps you filter out the extra stuff and get to the mentions that are relevant to the questions you want to answer. Written well, it ensures that most irrelevant mentions are excluded and that you find the insights you need.
Read on to get valuable tips on how to write a good query and improve your query writing skills with the help of the latest technology.
What is a query?
Working with social listening platforms like Brandwatch Consumer Research starts with the query. In this first step, you define what kind of data you want the platform to collect. It provides instructions to the crawlers on what to look for in a mention.
A query is a search string made up of keywords, terms, and Boolean operators (more on this later).
Before you start writing a query, you should think about what answers you want to find with your analysis. What use case do you have? Do you want to track a particular campaign? Do you want to research an industry? Or do you want to find out what consumers are saying online about your brand or a specific product?
Define the questions you want to answer. This will help you determine what areas you need to cover with your query and avoid an overly broad approach.
How to write a good query
Once you have the set of questions you want to answer, you can start building your query. Depending on your use case, the query you build will look different. For consumer opinion queries, you need a different approach than for tracking a brand campaign.
In general, think about all the different terms, such as brand or product names. Also consider all the different ways people might write about them online, including common typos and misspellings. Also add relevant hashtags, account handles, or websites.
If you want to analyze consumer opinions, it may be helpful to add pronouns to your main terms, such as I, I’m, me, we, or us, to get mentions from individuals discussing their personal experiences.
Also, think about things you are not interested in. For example, you may want to see online conversations about your brand's products, but you are not interested in mentions of offers and discounts. You can exclude these from your query.
A fundamental part of any query is the Boolean operators. Unless you’re searching for a single word, your query won’t work without operators.
What are Boolean operators?
Boolean operators are simple words or symbols that in this case give a computer some criteria to use when searching. Words such as AND, NOT, and OR are all Boolean operators. You might be familiar with Boolean logic from your high school math class. A common example is the Venn diagram.
Let's take a look at the most important Boolean operators for writing queries.
If you have a brand name or phrase you want to track that consists of two or more words, the quotation marks operator comes in handy. Use quotation marks to group them together and indicate that you want the query to search for that exact phrase only.
“mercedes benz”
You can use the OR operator to list multiple words that you want the query to search for. For example, if you want to search for different products or brand names, including different misspellings, you can use the OR operator to list them in one search string.
holiday OR vacation
The AND operator can add context to your query string when you're looking for something that doesn't have a unique name. A common example is the brand Apple. Without adding context, the query will look for all kinds of mentions that include "apple," many of which will have nothing to do with the brand but with the fruit.
To avoid this, you can use the AND operator and add different keywords to make clearer what you are looking for. For Apple, the search string might look like this:
Apple AND (mac OR iphone)
The AND operator searches for the two terms anywhere in the mention but, depending on the length of the quote, this may not be relevant enough. The NEAR/x operator is the smarter version of the AND operator. It defines how close the two terms should be and the maximum number of words between them.
For example, using NEAR/10 will return mentions that contain two terms that are near each other, with a maximum of 10 words between them.
Dominos NEAR/10 pizza
The average sentence is 10 to 15 words long. Setting the NEAR operator between 10 and 15 can be a good starting point to get mentions that are more relevant to what you’re looking for.
The NOT operator, as its name suggests, tells the query what not to include in the search. This allows you to exclude various keywords.
For example, you may want to see mentions about your brand, but you're not interested in online conversations around discounts:
Airpods NOT (offer OR discount)
You can save a lot of time by using the wildcard operator (*). This is useful when you want to see different variations of a phrase without having to type each variation.
For example, you want to look at online conversations around complaints
complain OR complaint OR complaints OR complaining
Instead, you can use the wildcard operator to shorten your query string:
complain*
This saves a lot of time without having to write everything out, and it keeps the query readable and simple.
Another important operator is brackets. They help structure the query string, especially as it becomes more complex. They indicate which terms should be grouped together if the query has multiple operators. Here is an example of a query string with more than one operator:
Dominos AND pizza OR takeaway
Here you have to use brackets to make it clear which terms should be grouped because you can’t have AND and OR at the same time. The above query string will not work. Since you are interested in mentions of Dominos and pizza or Dominos and takeaway, you need to put the parentheses around pizza OR takeaway:
Dominos AND (pizza OR takeaway)
There are other operators you can use to define your queries, such as location or language operators. You can be very specific about what mentions you want to find, so take a look at the other operators available to see if some might be useful to make your query string more relevant.
Quick query writing checklist
Now you know what Boolean operators are and how to use them. Here is a quick checklist before we take a look at writing queries with Brandwatch.
- Define your research question(s). What do you want to answer with your query? What is your use case?
- Add keywords. Don't forget common typos and misspellings or relevant hashtags, account handles, websites, and products.
- Add context. Use Boolean operators such as OR and NEAR/x to add context to your keywords.
- Add exclusions. Exclude keywords, hashtags, sites, etc, that are not relevant to your search
- Test and repeat. Test your query for relevance and adjust your search string. This might include setting the NEAR/x operator to a lower number or adding more exclusions.
Pro Tip
Tip 1: Keep it simple. If the simple query works, don't try to overcomplicate it. Some brands have unique names that aren't used elsewhere, so there's no need for a lot of exclusions and context words.
Tip 2: If your exclusions list more keywords than your main keywords, you may want to add more context, as this could be a sign that your main keywords aren't yet relevant enough.
Tip 3: Even if the query is complicated with a lot of operators, it's usually best to have a simple structure consisting of 3 parts: [main term] NEAR/x [context terms] NOT [excluded terms].
Tip 4: You can use <<<Notes>>> to structure a longer query to make it easier to read.
The most common query-writing errors
Writing queries takes practice, but you will learn from your mistakes. And you will make them, as we all do. Here are some of the most common mistakes to keep in mind:
- Write operators incorrectly: Operators must be written exactly, including the correct capitalization. Watch out for operators written in lowercase, with too much space, or that have typos.
- Forget to add quotation marks: Without the quotes, the system doesn't know that these words should be grouped together, and the query string as a whole won't work as intended.
- Missing brackets or not closing them: Missing brackets can be an easy mistake to make, especially if you need to use multiple brackets in a query. Without the correct brackets, the system will be confused about what to look for and won't work.
Writing a query in Brandwatch Consumer Research
Now that you know what a query is, what Boolean operators are, and what common mistakes to avoid, let's take a look at how to write queries with Brandwatch Consumer Research. The platform offers several options and features that make writing queries easy. From simple campaign tracking to complex market research, you can use Brandwatch for any type of question you have about your customers, competitors, or markets.
There are four ways to create a query in Brandwatch. You can choose a brand query template, define a non-boolean query, write a query from scratch, or get help with our Iris AI query assistant.
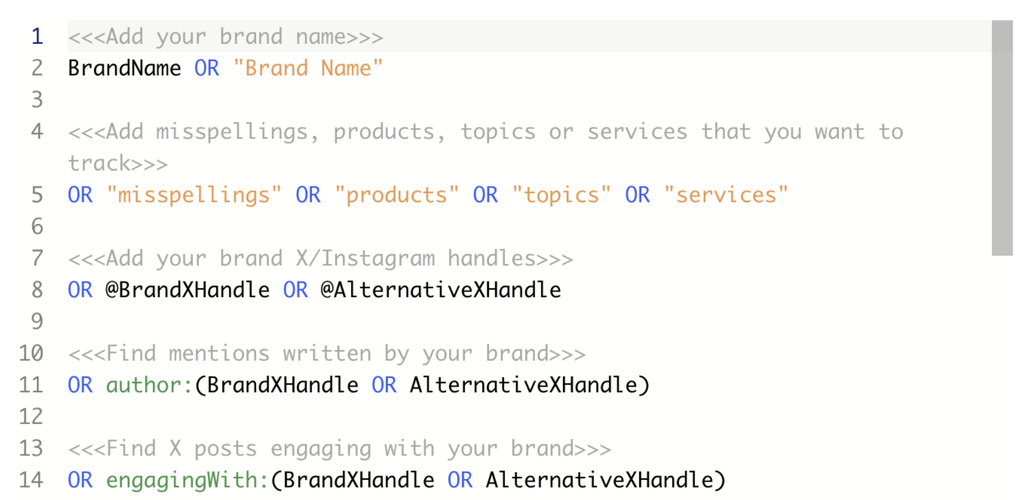
1) Brand query template
With the brand query template, all you have to do is fill in some brand details and the query is ready to go. The template provides you with a high-quality brand query that can be quickly customized with your brand details. It saves time and can give you inspiration for future queries.
2) Non-Boolean query
Another way is to set up a query without a Boolean search string which still gives the crawlers information about what to look for. Here you can add data from tracked Facebook Pages. You can search for online posts that contain specific logos or images that show specific objects, actions, or scenes. You can also select a pre-built Social Panel to better understand a specific audience.
3) Blank query
Clicking the blank query option opens a blank query where you can write your query from scratch using the full list of operators. You also have a variety of filter options to help make your query more relevant, such as languages, content sources, or pre-set exclusions like mentions of deals and promotions.
The editor highlights any mistakes you make in your search string, such as missing brackets. It also provides helpful tips such as explaining different operators, query writing tips, query examples, and links to other helpful resources.
If you need more help or are looking for ways to improve your query, the Iris AI query assistant comes into play.
4) Improve your query writing and save time with our Iris AI query assistant
Our Iris AI query assistant combines both proprietary and generative AI to help you to take your query writing to the next level. Based on the information you enter in the query editor, the assistant provides you with suggestions that you can add to your query string to collect more relevant mentions. The assistant makes suggestions on:
- Entities: It's like a quick search in the query editor. Type a term in the search box and Iris will generate entities. Select all the entities relevant to your query and the assistant will generate the search string for you.
- Keywords: Provides related terms and keywords for each word in your query. For example, if you want to do a query on electric vehicles, you can enter that term and it will provide you with synonyms such as EVs, electric transportation, battery-powered cars, and so on. You can then select the keywords you want to add to your query.
- Hashtags: Like keywords, it gives you hashtags related to your brand, products, or campaigns. You can choose between topic hashtag suggestions or brand hashtag suggestions. For example, if you want to find hashtags related to Apple, you will likely get suggestions like #applewatch, #iphone, or #macos.
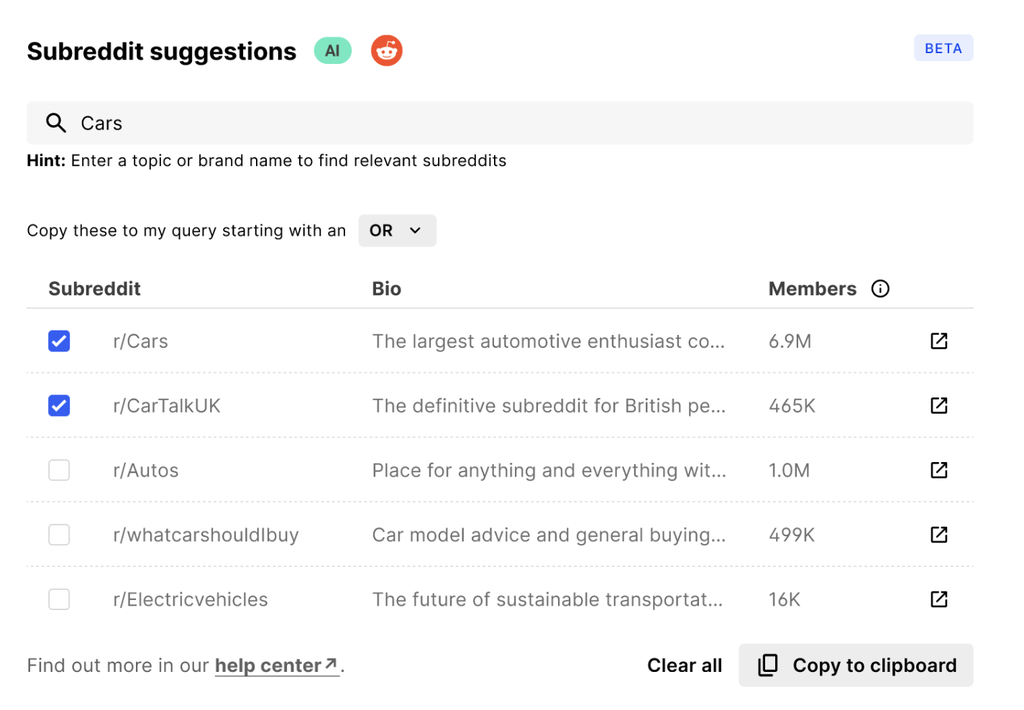
- Subreddits: Subreddits are a valuable source of unsolicited consumer opinions. Enter your brand, product, or topic of interest and get a list of relevant subreddits to add to your query.
- Multilingual support: Gives you keyword suggestions in another language. Enter your search terms and the assistant will give you keywords in the language you choose.
Pro Tip
In the Query Editor, you can enable AI-powered entities suggestions as you type. This can help suggest useful entities to add to your search to collect relevant mentions of any brand, product or topic that has its own Wikipedia page.
With Brandwatch Consumer Research, users have a variety of options for how to build a good query, depending on their expertise and resources.
From simple campaign tracking to complex market research, brands can use Consumer Research to answer any type of question they have about their customers, competitors, or markets.
That’s a wrap
For beginners, writing queries can seem daunting at first, especially if you have never worked with Boolean operators. Start by thinking about your research questions. They will be your golden thread for building a good query.
With this blog, you now have an overview of the basics of query building. Start practicing, and soon you will master the art of query writing.


