5 Benefits of Combining Social Data with Search Data
By Emily SmithMar 25
Only 25% of marketers truly understand their audience. Do you? Join us for a candid conversation and discover the tools and skills top marketers are using in 2026.
Published February 12th 2019
Introducing Vizia Reporting: Change your relationship with reporting with automated, live and beautiful reports. What's more, understand exactly who is viewing your work and the most impactful content.
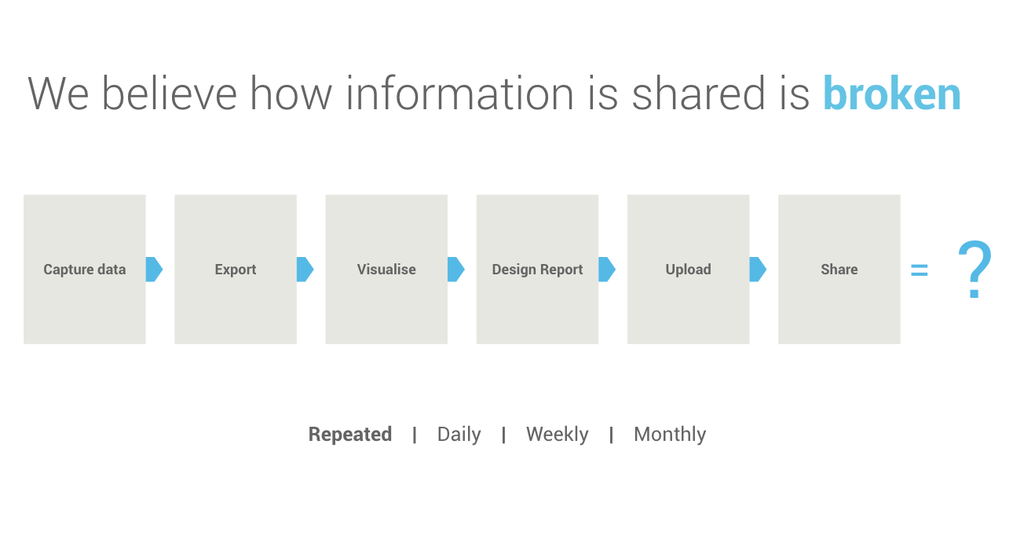
Are you sick of reporting?
If yes is the answer to any of these questions, then we have good news for you.
Today we are launching an entirely new way to deliver data insights from Brandwatch’s Vizia platform. It will allow you to save time, be more productive, and drive your team’s performance.
It might sound too good to be true, so let me explain a bit more.
The way we currently do reporting is fundamentally broken. You may have never considered this, but we have – admittedly quite a bit.
Think about it:
Then this is repeated on a daily, weekly, or monthly basis, with little or no visibility on whether it’s actually useful for or even read by those you share it with.
Firstly, this is a unnecessarily time-consuming process that involves multiple unautomated and unintegrated steps.
Secondly, what happens when you send this information?
Why is it that you can measure the results of a campaign or project but you can’t measure the reach of your own work? Why can’t you see who is viewing your reports and why can’t you understand the preferences of the people that are consuming your insights?
Reporting sucks but it has to be done. We know we can’t replace it but we believe we can make it a lot better. We want to help you change your relationship with this mundane and tedious task in a way that makes it a joy for both you and the report consumer.
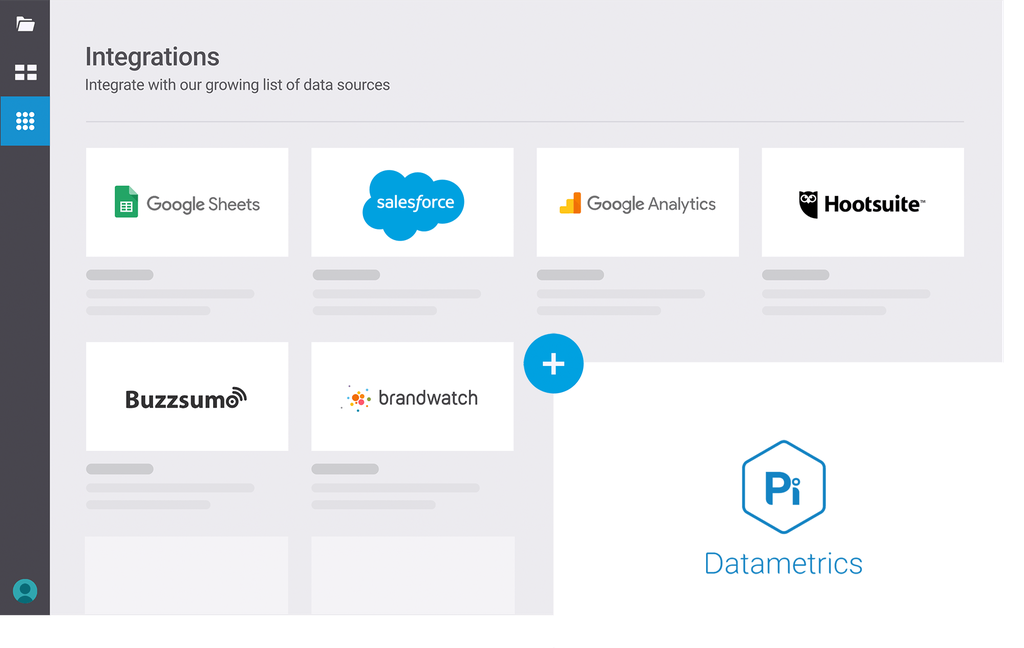
1. Integrate.
Allowing our users to connect their key social, marketing, and customer data sources effortlessly.
Integrations including Brandwatch Analytics, Crimson Hexagon, Google Analytics, Facebook Ads, and Pi Datametrics give a complete view of your customer and marketing data, making it easier to spot opportunities and identify threats.
Automating these data sources into a single perspective eliminates the need to export data from multiple sources at cadence, ultimately saving time.
2. Build.
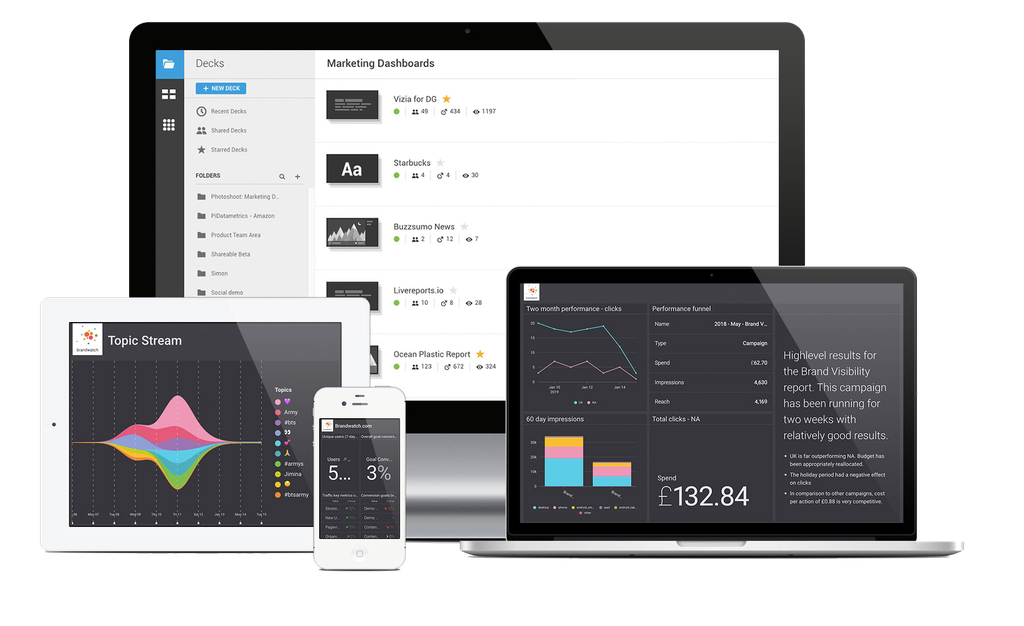
Enabling users to create beautiful and insightful data visualizations.
We truly believe that the easier the data is to understand, the more actionable it becomes. This becomes really important when embedding data within the organization.
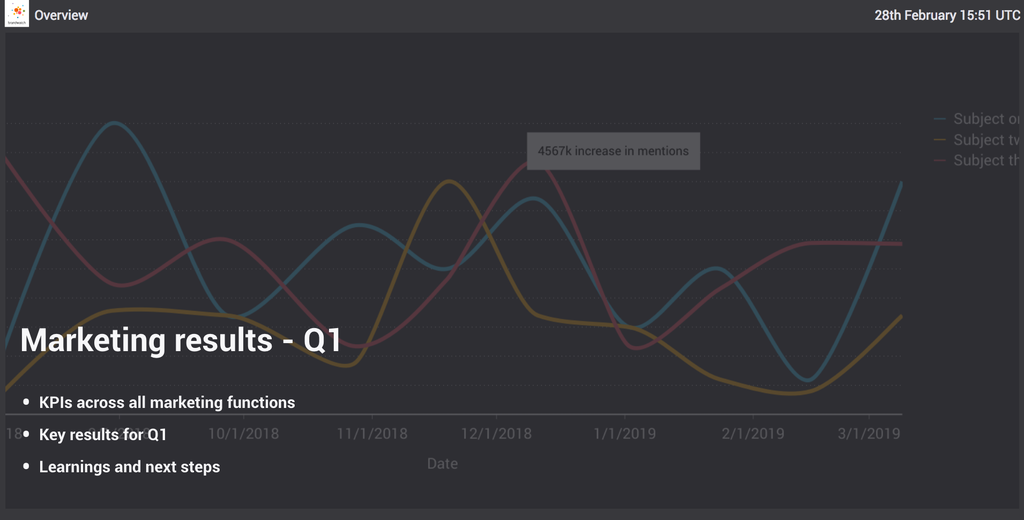
With over 40 data visualization components, we are giving our users the tools they need to create impactful yet accessible data reports.
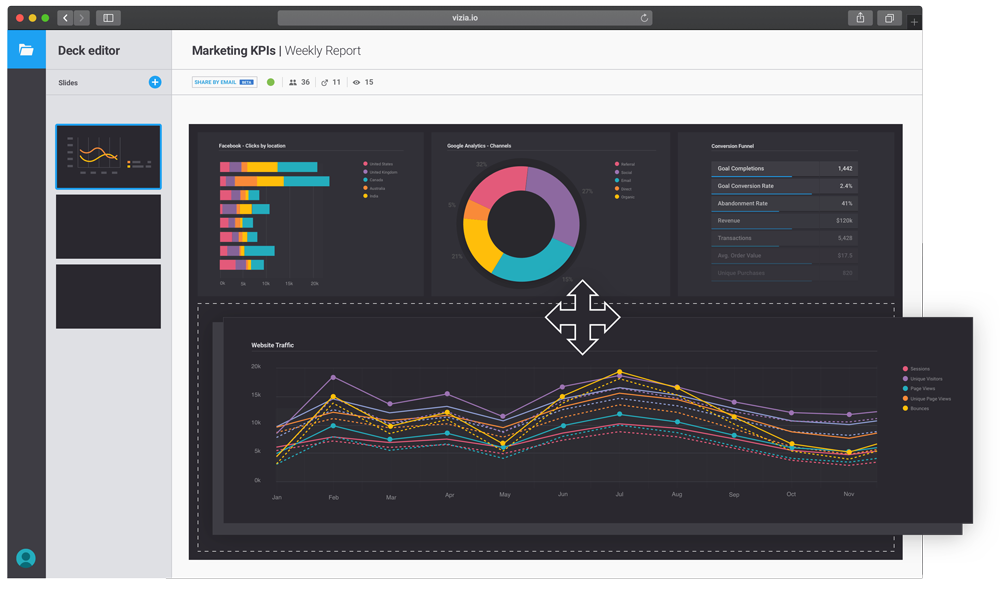
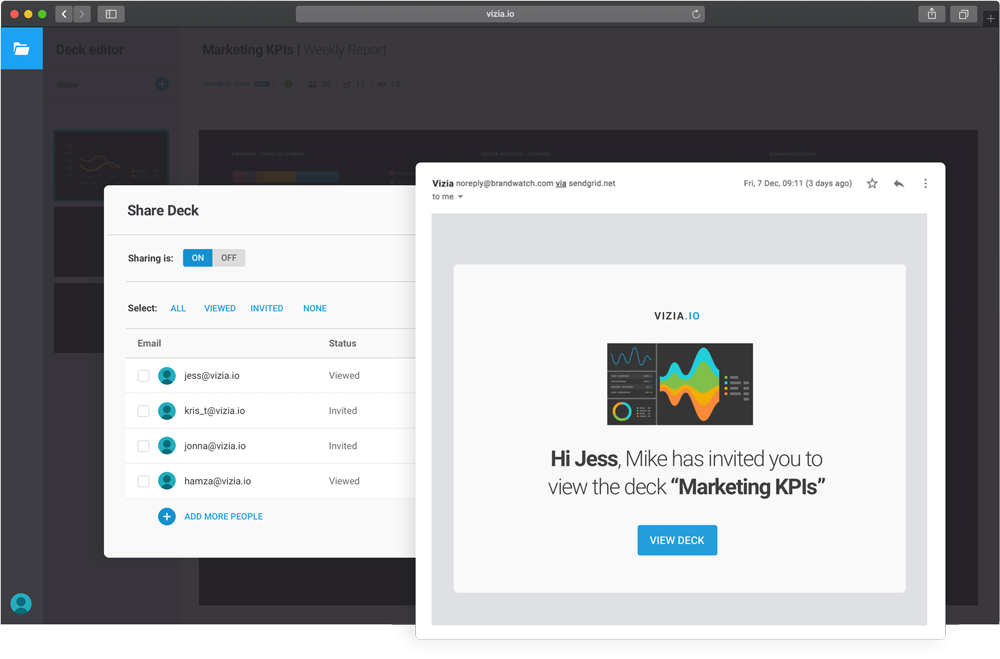
3. Share.
Seamlessly and simply distribute information directly to the desired recipients’ inboxes.
Input email address and hit send. Not fluff, no faff, add a message if needed. Do these people need a password to access the report? Of course not!
We want to make it as straightforward as possible to consume this information. On the bus on your phone, during a meeting on your laptop or with your tablet on your couch. Whatever your preference for consuming data insights, we’ll be there for you.
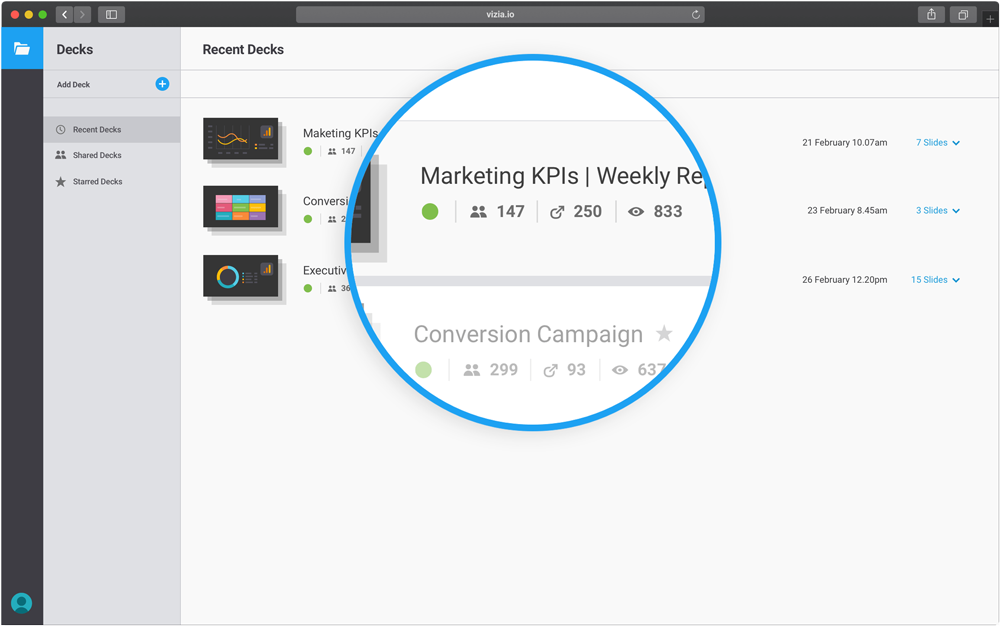
4. Measure.
This is the exciting bit.
No longer will you send your reports and insights into the ether wondering if they’ve been viewed, wondering if they’ve had the impact you intended, or wondering if anyone has even opened them.
We’re giving our users visibility on their reporting analytics. Deck level metrics show how many times they’ve been opened, even down to an individual level. Slide metrics show you exactly what content has been most viewed, allowing you to make crucial decisions about the content you’re sharing.
1. Save time and be more productive.
Save crucial time by automating data from your key sources and then streamline the distribution of this information. Create stronger bonds between teams and departments by allowing for on-demand and more accessible data. Understand exactly what content is landing and what’s not so you can iterate and focus solely on the work that’s delivering value.
2. Drive data culture.
Use integrated data to maintain a complete and constant customer view. Enable greater decision-making by making this data available across the organization and ensure it’s easy to understand and actionable with expertly-designed visualizations.
“The ability to quickly share out our dashboards across a number of different teams and departments has helped us build stronger relationships with our internal stakeholders”
– Bianca Sauceda, Media Intelligence Analyst – Uber
3. Improve marketing performance.
Eliminate the blockages and unfulfilling tasks that congest your team’s week. The less time spent on reporting, the more time is available for innovating and optimizing work.
4. Complete the reporting workflow.
Slide-level metrics help you understand the specific content that is landing well, and the stuff that’s not. Bring efficiency to the way you report by doubling down on the valuable insights. Use the insights gleaned from deck and slide metrics to optimize the entire reporting workflow. Ensure you’re delivering the right information to the right people, all of the time.
“Brandwatch has taken Vizia’s visual intelligence to an entirely new and innovative level with the new reporting capability – it literally brings reporting to life. Aside from reporting it has simplified the process of sharing the content by eliminating the need for setting up additional accounts.”
– Lisa Grimes, Chief Listening Officer – Dell
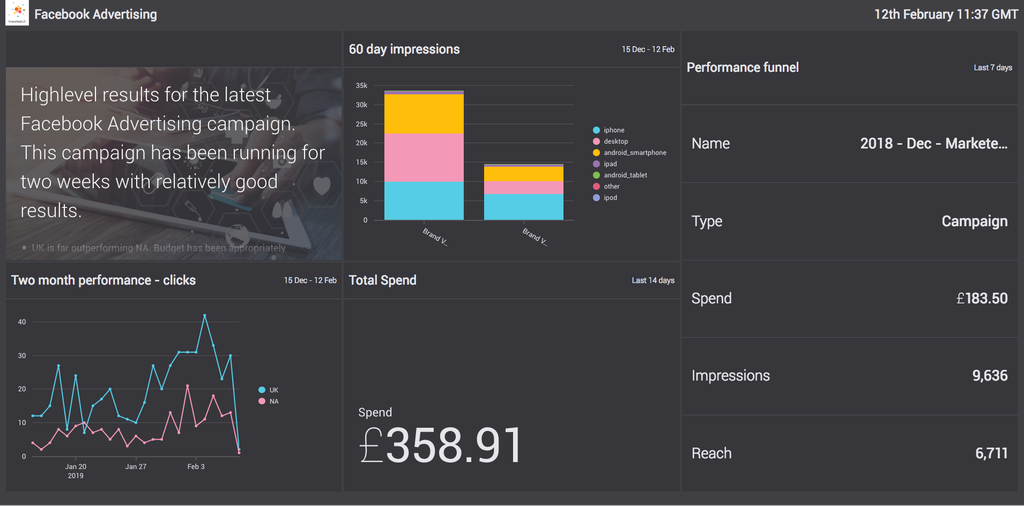
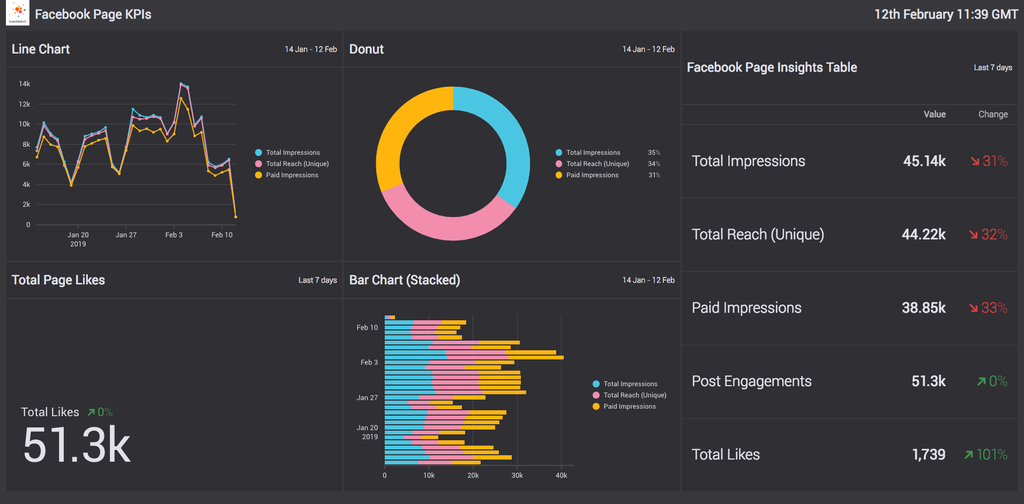
Not only do we want to help our customers to seamlessly embed data in the organization, we also want to give them the tools they need to understand their customers and drive marketing performance. That’s why we’re launching two new integrations that are entirely free to use for our customers.
Visualize key metrics from your Facebook and Instagram campaigns, ad sets and ads. Build compelling and insightful displays with 5 new visualization components.
Track the performance of your Facebook business pages with over 130 different metrics.
Data should tell a story and have a narrative. This is why the rich text component is important. We want to ensure our customers can bring data to life, not only with words, but with real context.
Time is too precious and the world is moving too quickly for us to continue to spend time on manual, tedious, and unfulfilling tasks. Vizia Reporting is built to help our customers dedicate more time to the work that really counts.
Watch our webinar to hear how Dell and Mindshare are already finding value from this technology. Watch here.
If you’re not a customer, click here to get a demo. A member of our team will show you how Vizia can help drive performance in your team today.
Learn how Dell and Mindshare are using a complete customer view to create efficiencies, drive performance and save time.
Chief Listening Officer & Strategist
Digital Insights Director
Existing customer?Log in to access your existing Falcon products and data via the login menu on the top right of the page.New customer?You'll find the former Falcon products under 'Social Media Management' if you go to 'Our Suite' in the navigation.
Brandwatch acquired Paladin in March 2022. It's now called Influence, which is part of Brandwatch's Social Media Management solution.Want to access your Paladin account?Use the login menu at the top right corner.