


5 Benefits of Combining Social Data with Search Data
By Emily SmithMar 25
Only 25% of marketers truly understand their audience. Do you? Join us for a candid conversation and discover the tools and skills top marketers are using in 2026.
Published August 27th 2020
Understanding social mentions in relation to population
If you’ve ever worked with social data visualized using maps, you’ll be familiar with their tendency to always look the same.
This is usually caused by an imbalance in the population of countries or regions. US states like California, Texas, Florida, and New York, for example, have much higher populations than the other 46. Around a third of all Americans live in those four states.
It’s not particularly insightful, then, to report that your latest national campaign was talked about most in these states – just like the last one was…
That’s why we’ve introduced a new ‘per capita’ map view in Brandwatch Vizia (and something similar is coming very soon to Brandwatch Consumer Research) which allows you to see where your brand or topic has been talked about the most times per million people who live in each country or region. This is extremely useful for answering questions that will inform important business decisions such as:
As an example of how this can uncover hidden insights, let’s look at a well-known global brand like Patek Philippe. This luxury watch maker was founded in Switzerland in 1839 and today has over 400 retail locations across the globe.
So where in the world does the name Patek Philippe have the strongest brand recognition? And where should the company focus its next regional campaigns or open its next stores?
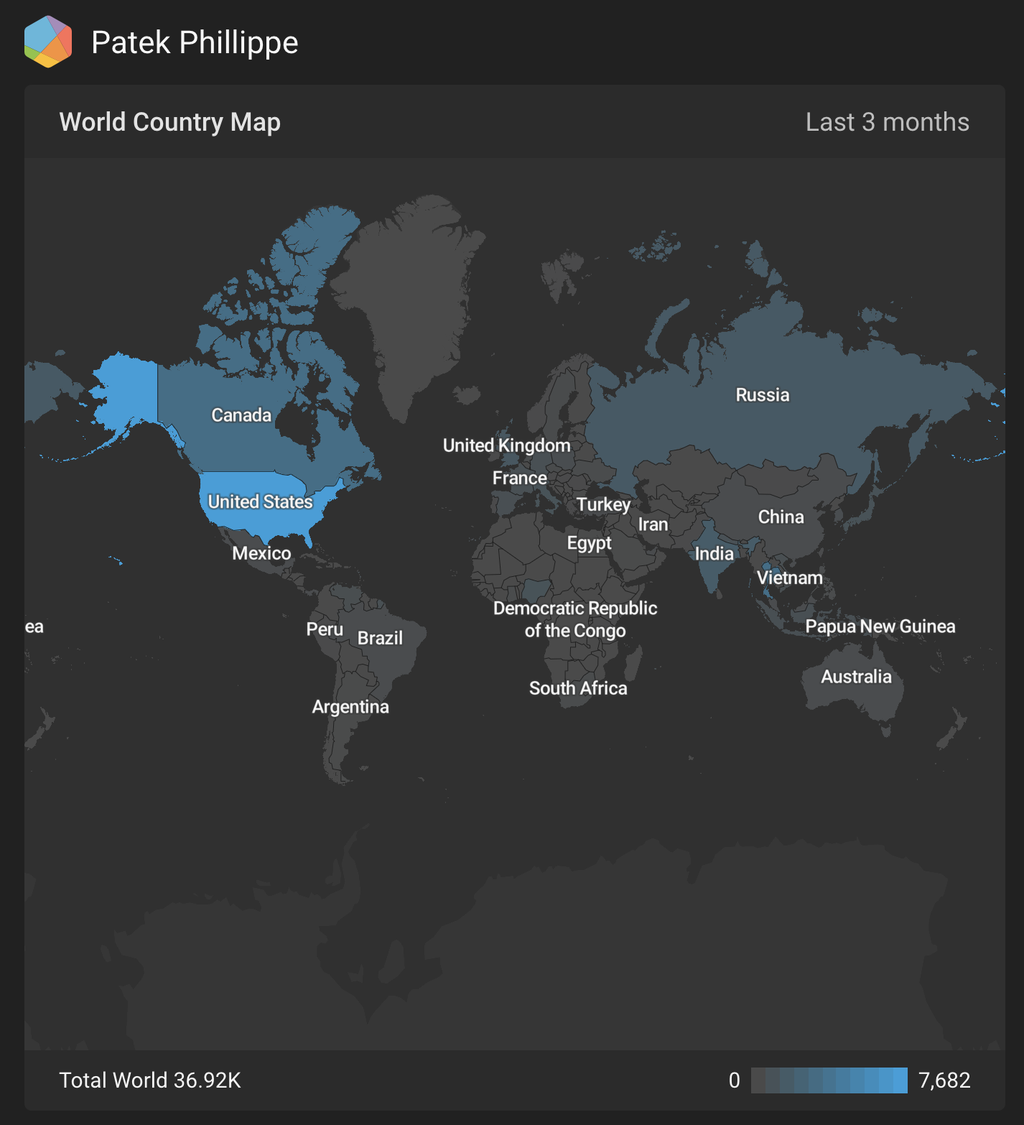
Let’s start by simply looking at a search for ‘Patek Philippe’ in all languages to understand where people are talking about it.
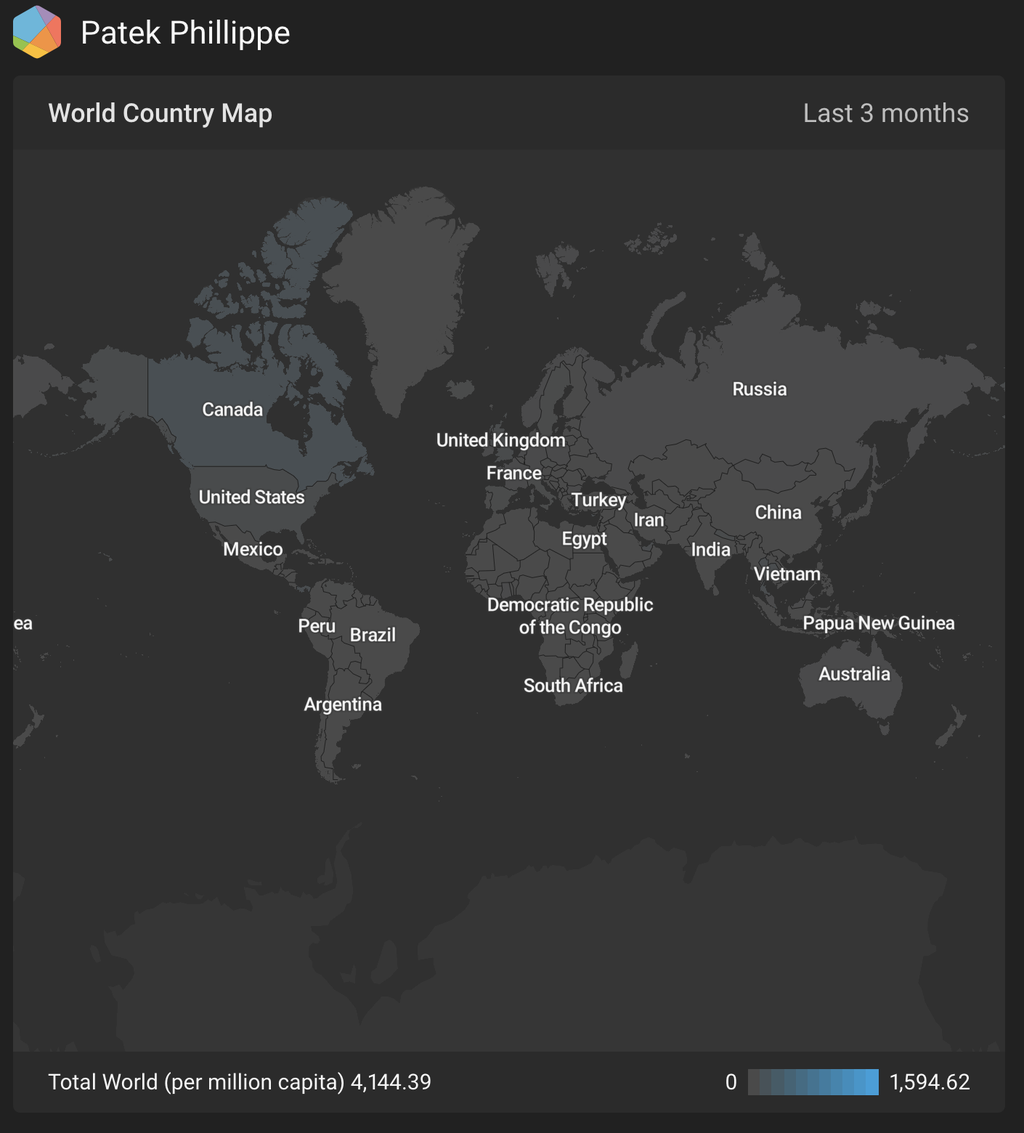
Looking at total volume, it looks like Patek Philippe is well known in North America as well as Russia and India. But what happens if we look at volume per capita instead?
The map almost seems to have gone blank. This is when Vizia’s animation feature really comes into its own. If we turn this on the map will start zooming in to the countries with the highest volume of conversation per capita.
Immediately we arrive in Singapore where there were the most mentions per citizen of any country. This makes sense given Singapore is a small but wealthy country. In fact the Vizia animation continues on what looks like a travel itinerary of a particularly busy billionaire’s private jet: Monaco, Turks and Caicos, the British Indian Ocean Territories… these are exactly the places where you’d imagine people buying a Patek Philippe.
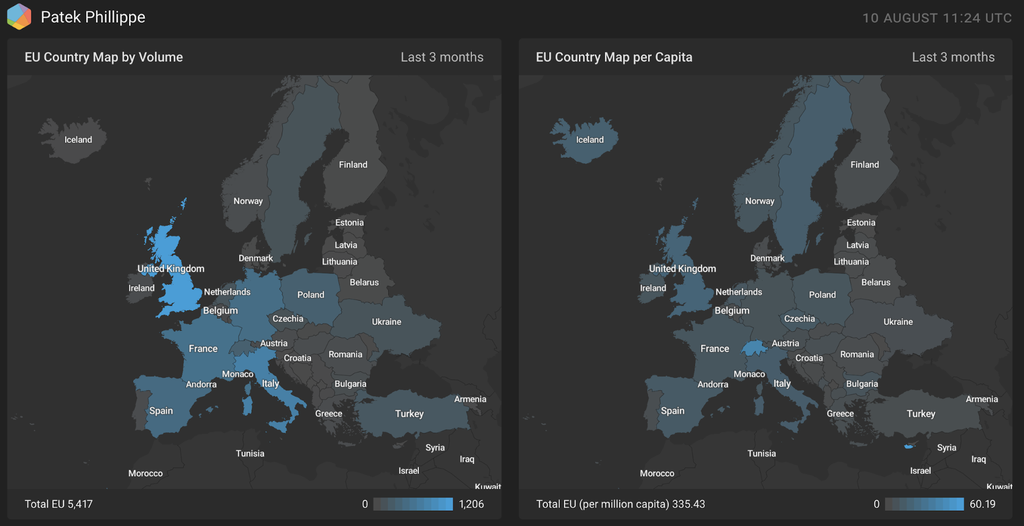
We can quickly filter out some of these smaller countries if we want to study some maps with a little more detail and identify larger places of interest to the brand. For example, in Europe we can see that while Patek Philippe is talked about most in the UK by volume, Cyprus by far has the most mentions of the brand per capita, followed by the brand’s home country Switzerland. Places like Sweden and the Czech Republic might also be interesting markets to explore.
The new per capita map can also help discover where consumer trends are strongest or to inform decisions about regional consumer appetite for different things.
For example, let’s imagine we are hoping to launch a new product – a peanut butter flavored milkshake drink (well it sounded good to me!). Which US state should we use for our limited-edition trial?
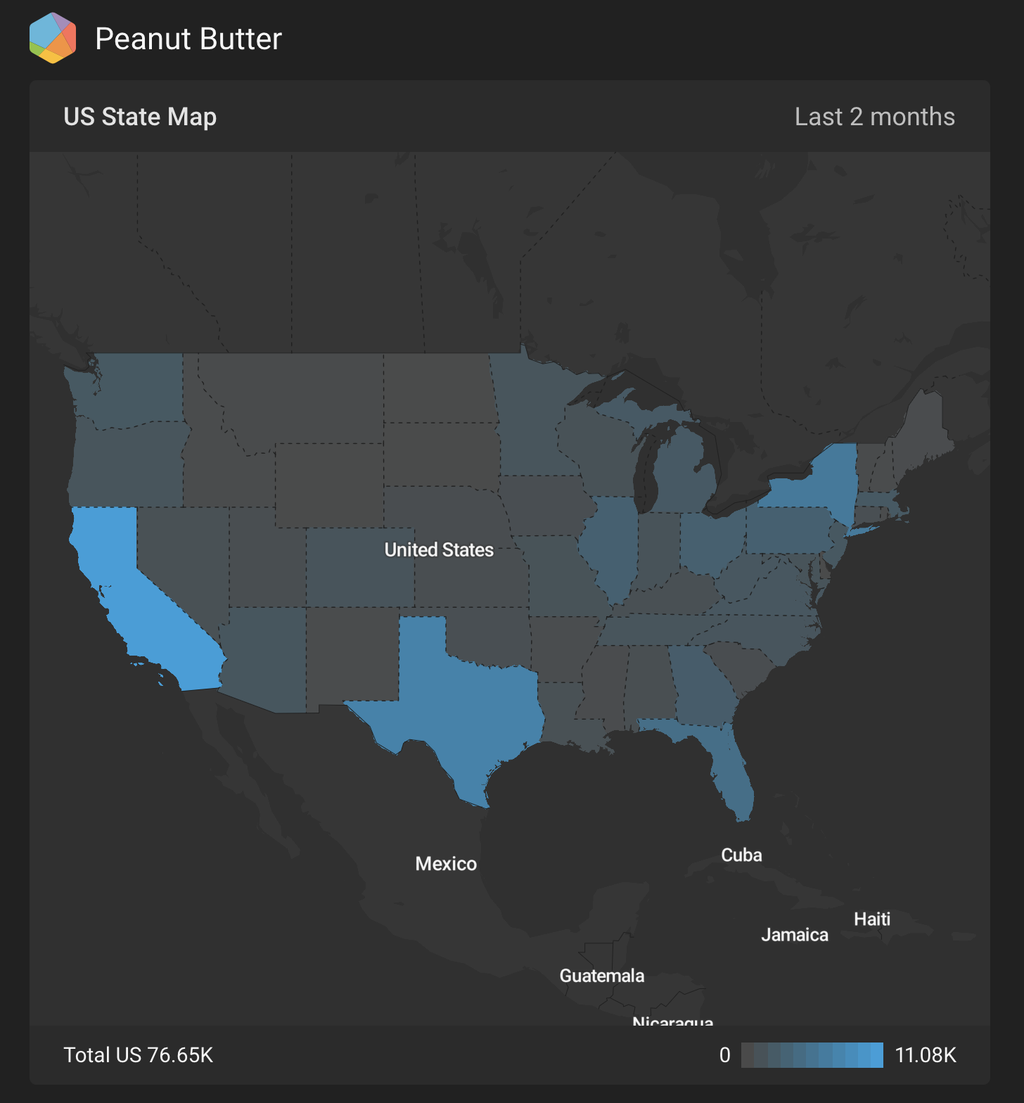
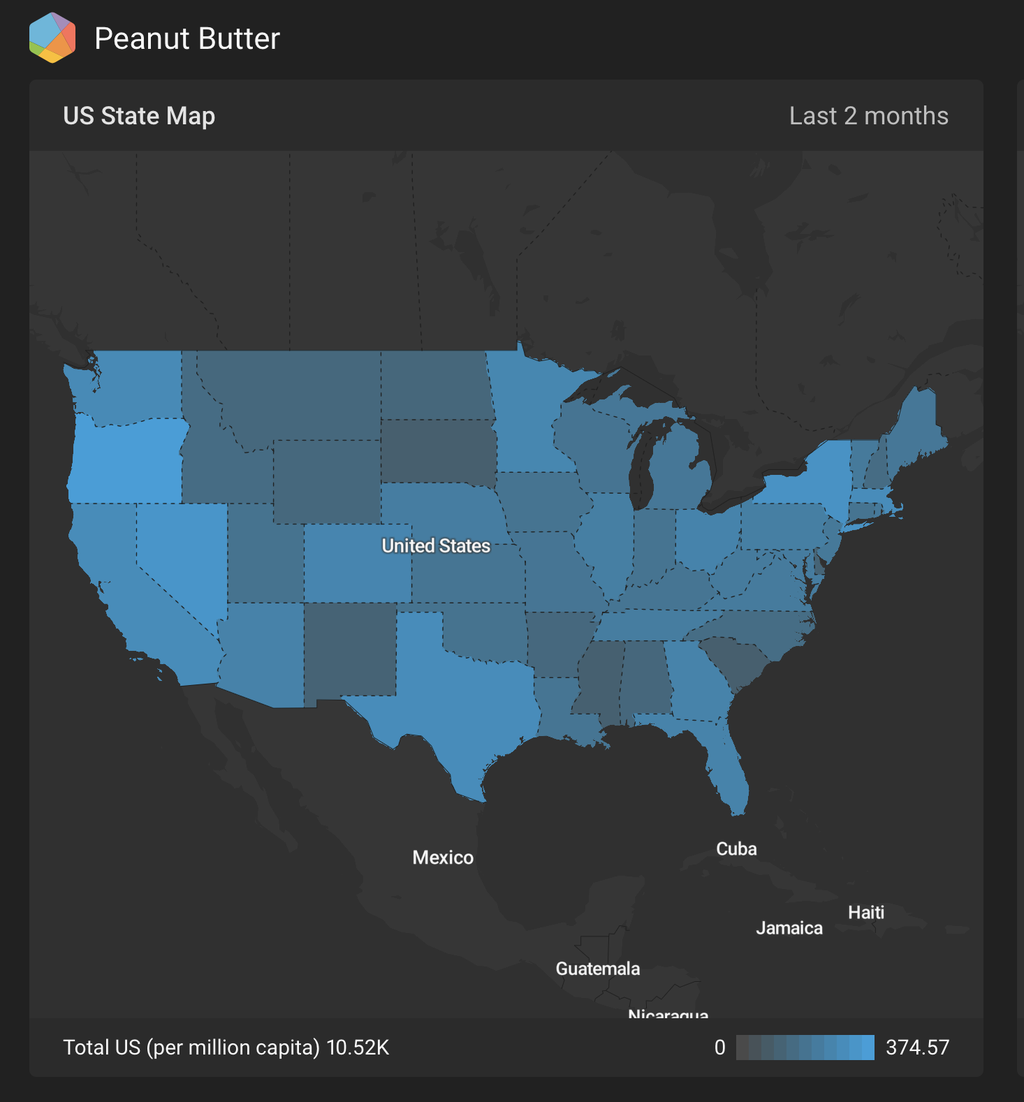
Let’s start simple for now and study people talking about ‘peanut butter’. If we look at a map of the US by volume, once again it’s the familiar four states that stand out.
But we can’t do these trials in New York, Texas, Florida, and California every time, it isn’t fair on the others. So let’s look again at the map by volume per capita.
First of all this new map view tells us that peanut butter is talked about much more evenly across the US than we might have thought when looking at total volume. This is good news for our future national launch, but in the meantime we can identify that Oregon and Nevada could be the best places for a local trial.
Location analysis in Brandwatch helps you find insights that can drive real business decisions. Book a meeting with our experts to see it in action.
Consumer Research gives you access to deep consumer insights from 100 million online sources and over 1.4 trillion posts.
Existing customer?Log in to access your existing Falcon products and data via the login menu on the top right of the page.New customer?You'll find the former Falcon products under 'Social Media Management' if you go to 'Our Suite' in the navigation.
Brandwatch acquired Paladin in March 2022. It's now called Influence, which is part of Brandwatch's Social Media Management solution.Want to access your Paladin account?Use the login menu at the top right corner.