


5 times non-sponsor brands shined during this football summer
By Ksenia NewtonJul 16
Explore the live data behind football’s biggest global tournament.
Investigating global consumer behavior changes across protective measures, leisure activities, and travel
What does life look like five months into the Covid-19 pandemic?
Using social data from Brandwatch Consumer Research, Brandwatch Qriously surveys, and Apple Maps data, here’s how consumer behavior is changing.
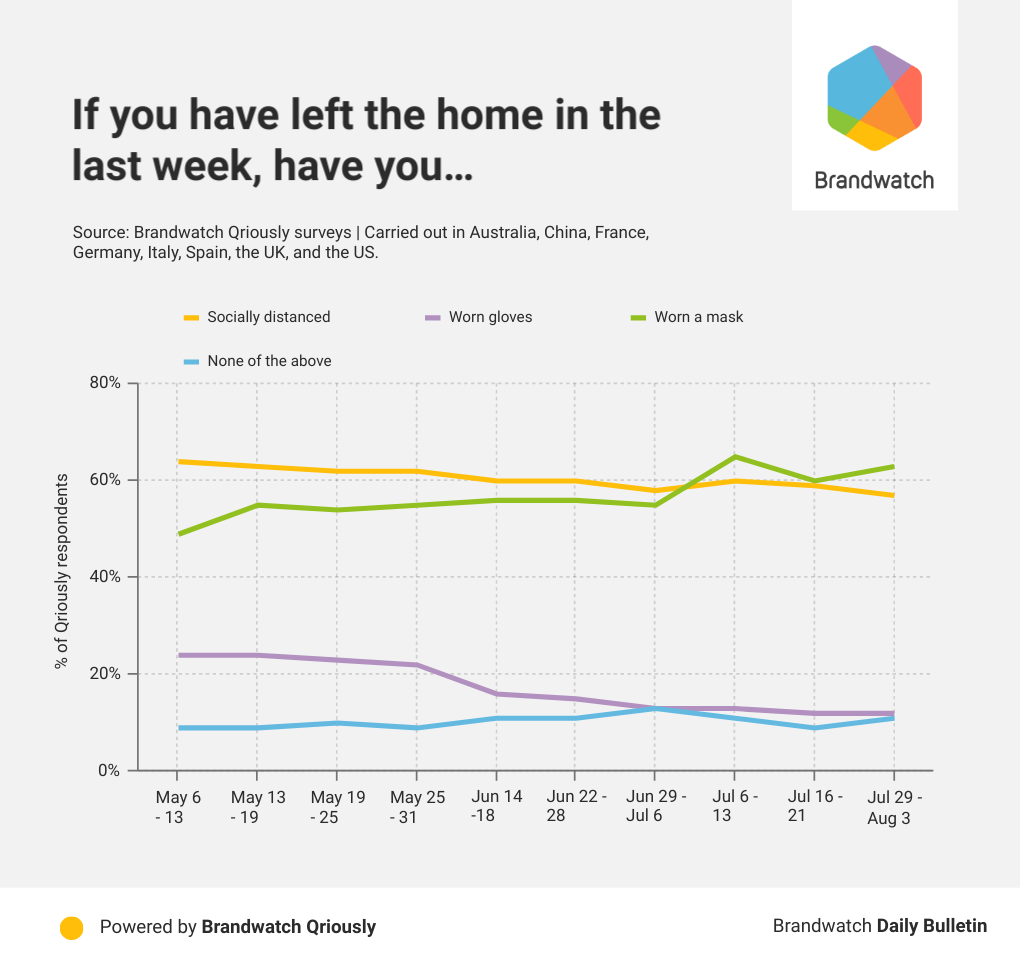
We started our analysis by using our mobile survey tool Brandwatch Qriously to look at how consumers have adopted Covid-19 protective measures into their lives.
The survey conducted most recently (between July 29 and August 3) asked 3,778 people in Australia, China, France, Germany, Italy, Spain, the UK, and the US what precautions they were taking if they’d left home in the last week.
In the latest survey, 57% of respondents said they were socially distancing and 63% reported wearing a mask. Only 12% reported that they had worn gloves.
Since we first asked back at the beginning of May, respondents reporting glove usage has dropped 12 percentage points and the number of those saying they’re socially distancing has fallen by 8 percentage points. This could be an indication that consumers are becoming more relaxed with their adherence to protective Covid-19 guidelines.
That said, the number of respondents reporting that they’re wearing masks has gone up 14 percentage points compared to when we first asked back in May.
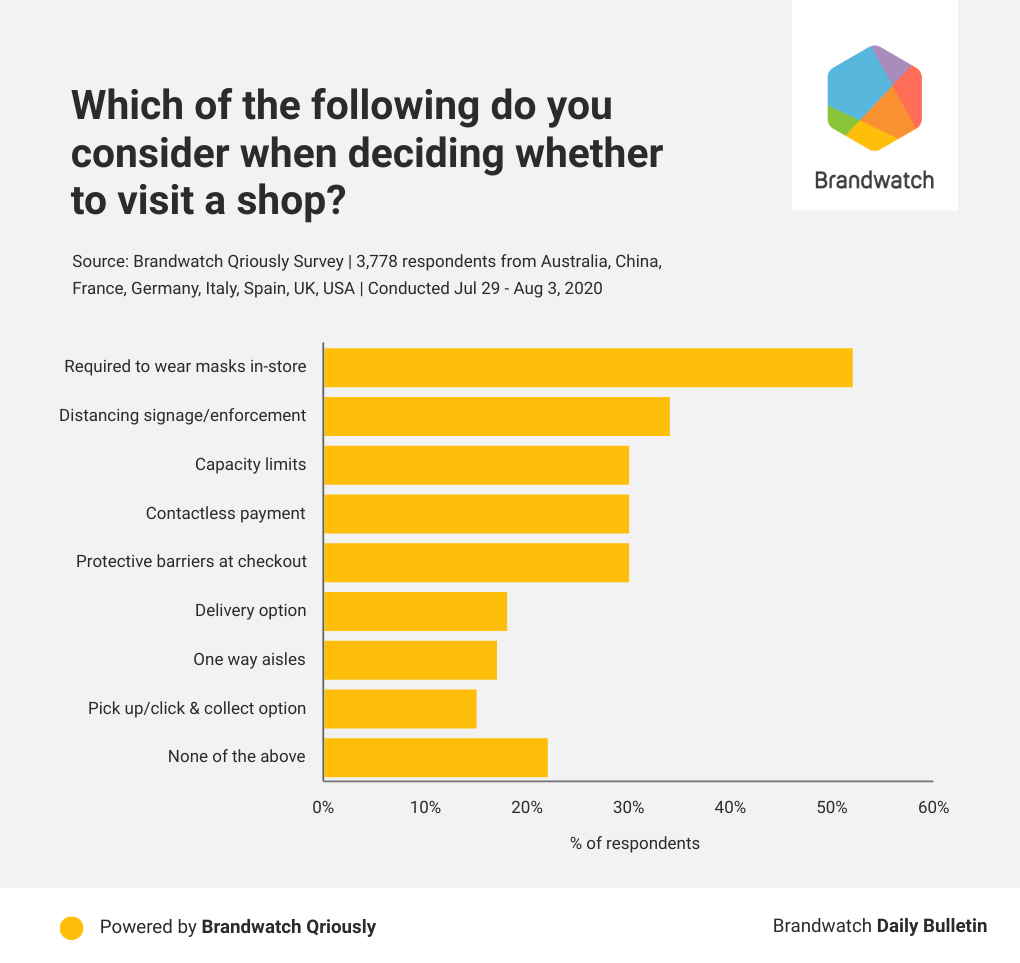
This continues to be a key concern, especially when entering shops. When we recently asked respondents what they consider when deciding to visit a store over half of them reported that face coverings were a key consideration.
This was followed by capacity limits, contactless payment options, and distancing.
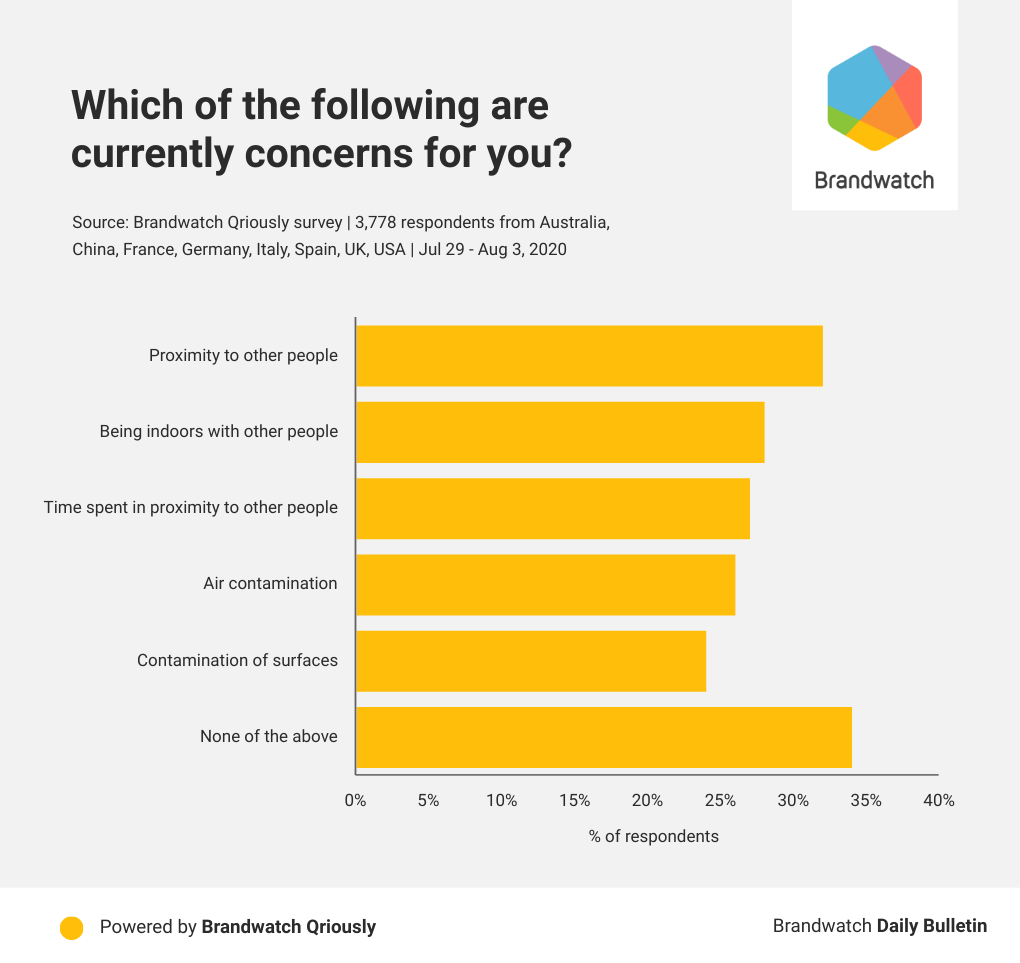
Consumers are concerned about their proximity to danger, not just in store but all of the time.
There’s a lot businesses need to contend with in terms of consumer worries, but that’s not to say people aren’t keen to get out and about.
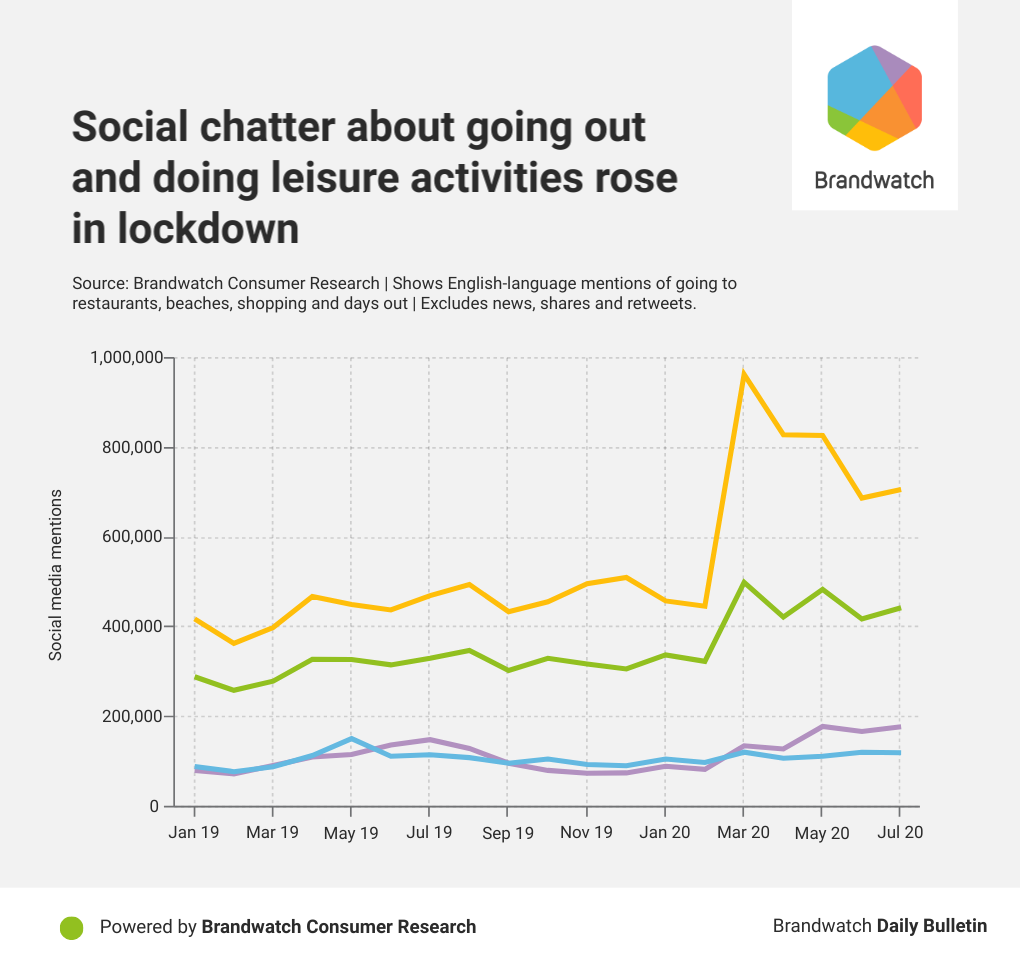
Using our Consumer Research platform, we found that consumers talking excitedly about going on day trips and visiting restaurants, beaches, museums, galleries, and amusement parks increased during common lockdown months.
Overall, these mentions increased 56% in the last five months compared to the five months prior, indicating that consumers were making plans and looking forward to some post-lockdown normality.
We found that shopping was the top-discussed leisure activity in the last five months, with mentions increasing 69% in comparison to the five months prior.
We also found that between March and July 2020, compared to the five months before:
That excitement is beginning to translate into action – as you’ll see below, movement is beginning to pick up in many cities around the world.
It’s all very well having plans to go out. But how are we getting to the places we want to go?
We looked at transport behavior patterns within France, Germany, Italy, the UK, and the US, using Apple’s Covid-19 Mobility Trends Report, to understand how consumers have been walking, driving, and using public transport during the pandemic.
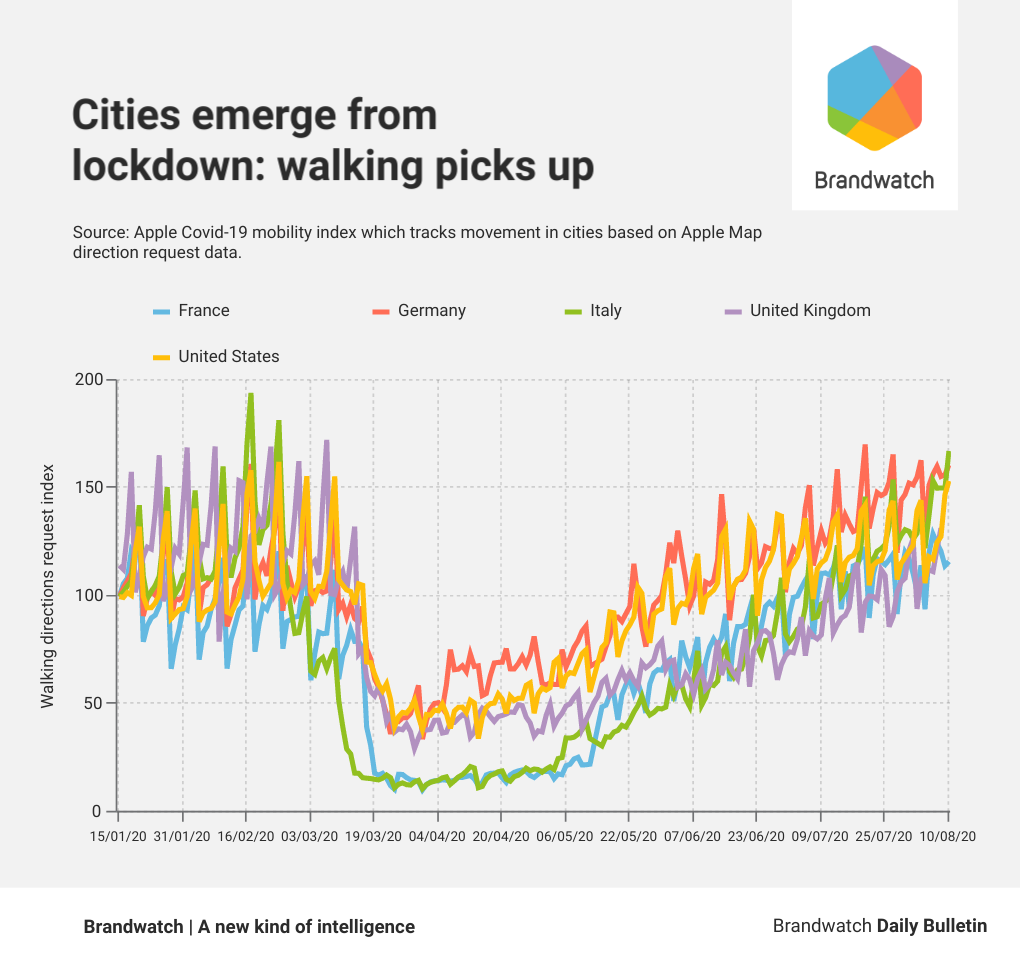
We learned that consumers are choosing walking over driving, and driving over public transport. Meanwhile, public transport use is yet to return to pre-pandemic levels in all but two of the countries we studied.
Walking had the strongest growth overall.
From May 15 to August 9 2020, the average number of people looking for walking directions in Italy increased by 119 percentage points. We also noted the same trend in France, Germany, the UK and the States, although to a slightly lesser extent.
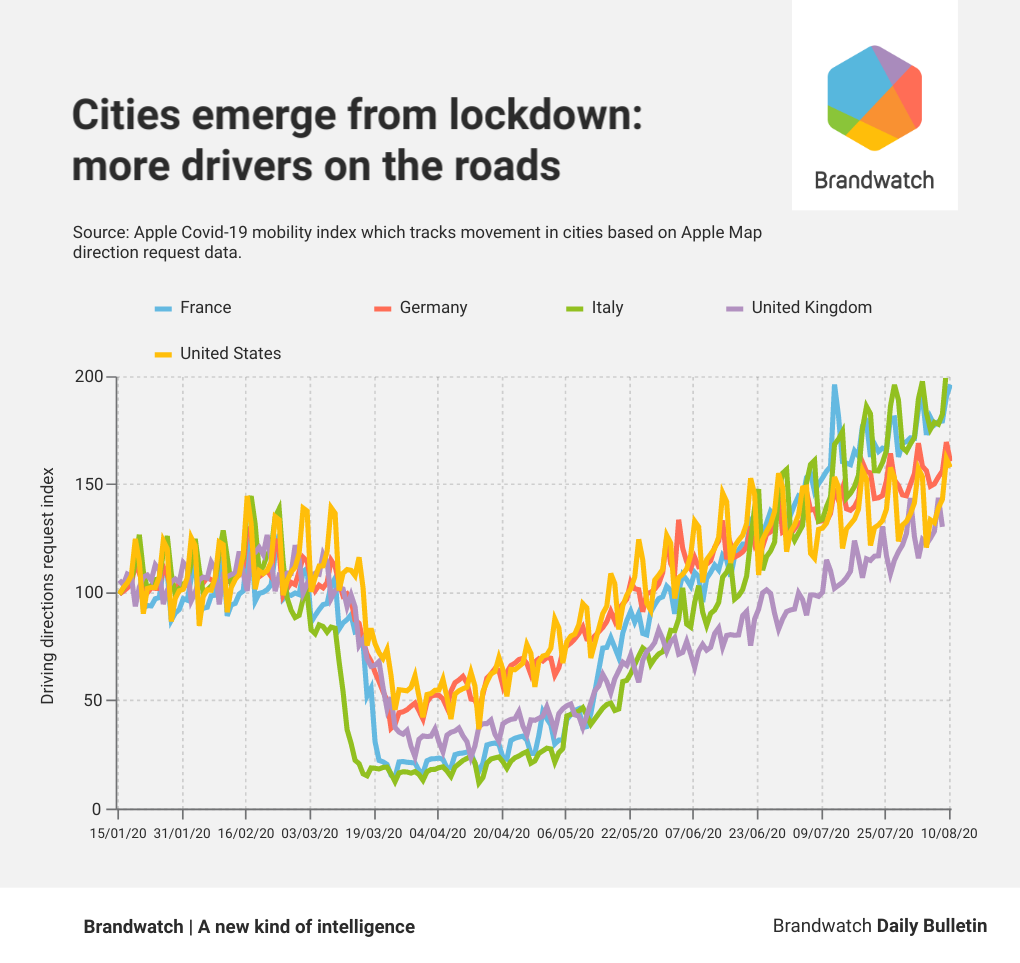
We also found that consumers are driving more. Apple’s data revealed the average number of consumers looking for driving directions in the countries we studied increased 89 percentage points from May 15 to August 9 2020.
Again, Italy was driving this trend. From May 15 to August 9, the percentage of people looking for driving directions in Italy increased 181 points. We also noted significant increases in the other countries we studied, but, again, not to the same level.
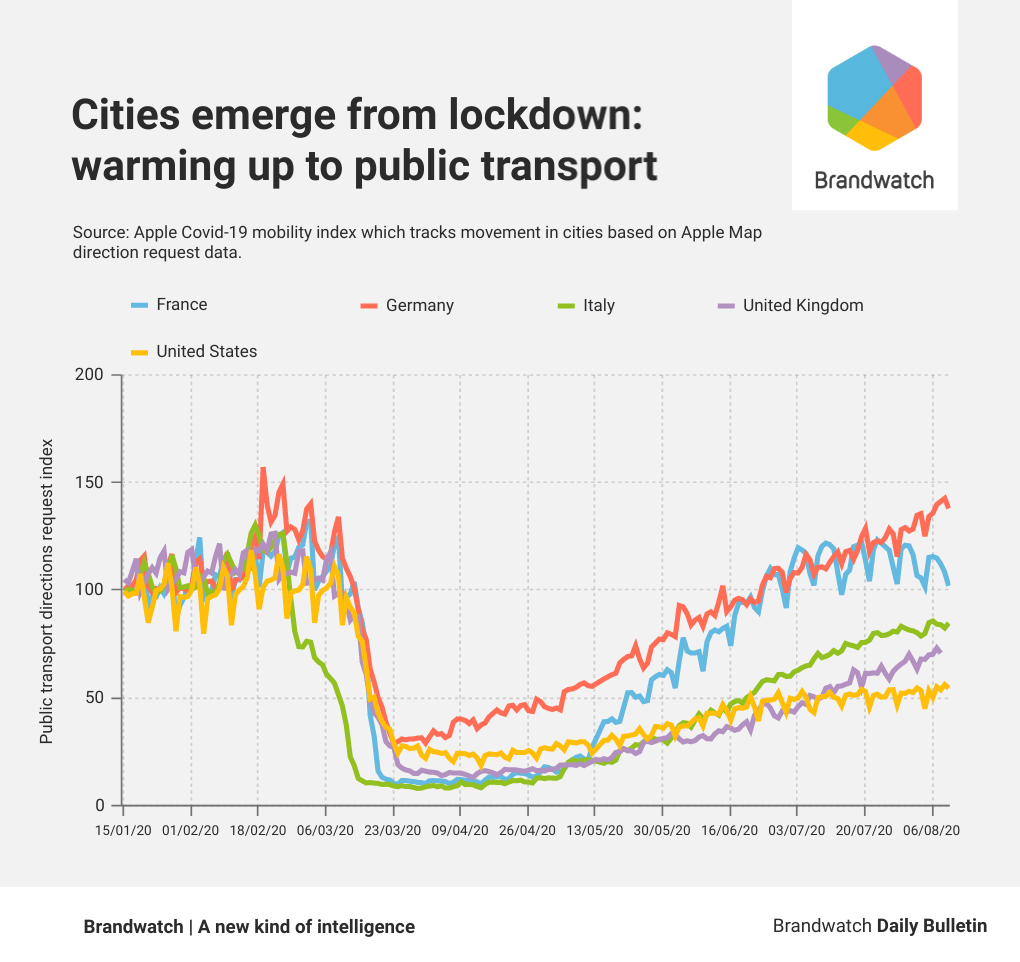
Meanwhile, public transportation is still taking a hit. For Apple Maps users, we learned that the average number of people looking for directions on public transport in the countries we studied decreased by 24 percentage points from March 1.
It’s only Germany and France who are back on board with public transport. In fact, on average, there are now more people using public transportation in Germany and France than there were in January and February, according to Apple’s data.
In some countries, consumers will choose the option which suits their journey. But in other countries, such as Italy, the UK, and the US, it looks like consumers will opt for personal transport regardless.
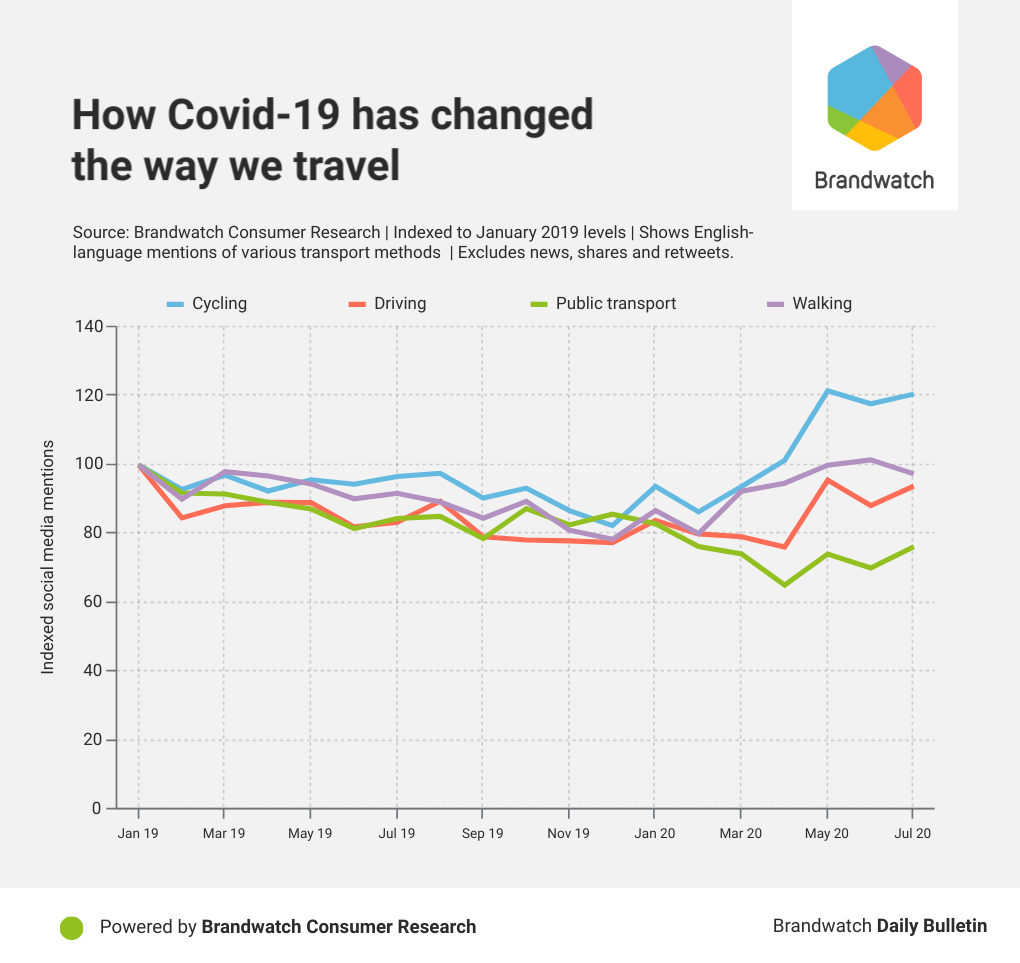
Using our Consumer Research platform, we looked at English-language mentions of people cycling, driving, or taking the bus, train, subway or tube, from January 2019 to August 9, 2020.
Cycling had the largest conversation increase of all the types of transport we looked at, with mentions going up 28% since March.
Interestingly, mentions of driving are only just beginning to take off — a contrast to Apple’s data, although we should note that we only looked at English-language social data. The difference could also be explained by people not wanting to show they were driving about during a pandemic, or by people using driving directions to plan their cycling routes (which could have boosted Apple’s driving numbers above).
Meanwhile, conversation about public transportation is yet to return to normal. In July, public transport conversation was eight percentage points off of pre-pandemic levels, and according to sentiment segmented data conversation was 70% negative. This is in contrast to only 30% negativity within conversations about cycling.
These are difficult times, but understanding consumer behavior patterns in things like transport, and the motivation behind those patterns, can help us understand the nuance of the crisis, and even play a role in preventing Covid-19’s spread.
What do you think? Let us know @BW_React, or if you’d like specific data relating to this query shoot us a line [email protected]
Consumer Research gives you access to deep consumer insights from 100 million online sources and over 1.4 trillion posts.
Existing customer?Log in to access your existing Falcon products and data via the login menu on the top right of the page.New customer?You'll find the former Falcon products under 'Social Media Management' if you go to 'Our Suite' in the navigation.
Brandwatch acquired Paladin in March 2022. It's now called Influence, which is part of Brandwatch's Social Media Management solution.Want to access your Paladin account?Use the login menu at the top right corner.