


Brandwatch Named a Leader in IDC MarketScape for Social Marketing Software for Large Enterprises
By Matt TippetsNov 22 2024
Explore the live data behind football’s biggest global tournament.
We are pleased to announce the winner of our use-case Dashboard competition: the Trends Dashboard, designed by Nathaniel Hansen of The Socializers.
All users can now access this fantastic new addition to the Brandwatch platform which joins the Influencers, PR and Reputation Management Dashboards released in July. Got a question for Nathaniel or a suggestion for the next Dashboard? Join the discussion at the Brandwatch Community Forum.
We had some excellent and varied entries to the competition.
We were particularly excited by this idea because it truly extends the scope of what it is possible to do with Brandwatch data and technology, and of course ‘Going Beyond’ is a key theme of our new mission.
As well as ‘watching brands’, Brandwatch can be used to track and analyze important topics that relate to your organization.
Keeping on top of key trends, knowing the relevant people and detecting valuable marketing moments can help you pro-actively reach out and expand your brand awareness where it matters most.
We caught up with Nathaniel to ask him how he came up with the winning entry.
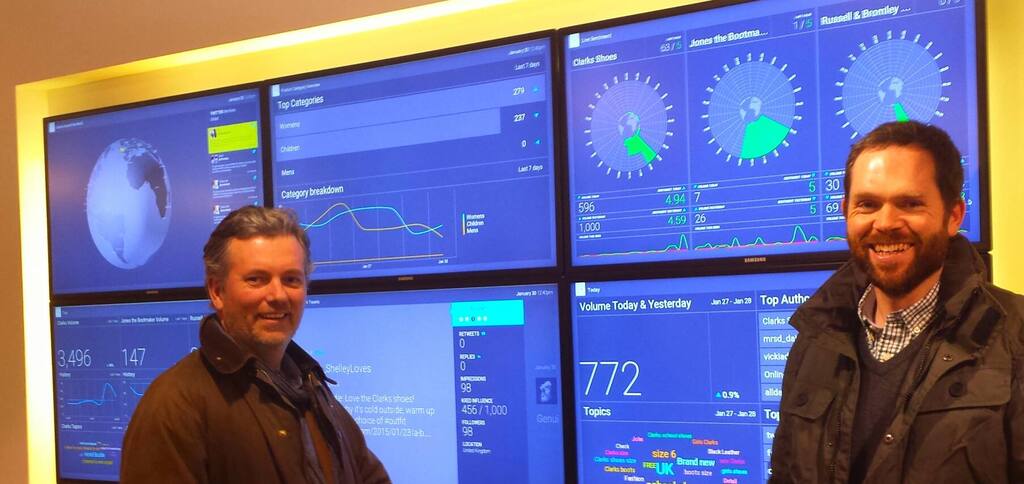
Nat: I am a research consultant from The Socializers, an agency currently working on contract with Clarks shoes at their HQ in the UK and actively working with their various silos and global regions to implement social listening.
I have recently also set up a Brandwatch Vizia listening hub for Clarks.
 My day-to-day work involves analysis of online conversation using the Brandwatch Analytics and Vizia solutions, writing insights reports, creating Dashboards for stakeholders and testing new and innovative ways to use social listening for brands.
Nat: I was working with Clarks shoes on their social listening hub and the request came in for a trends report.
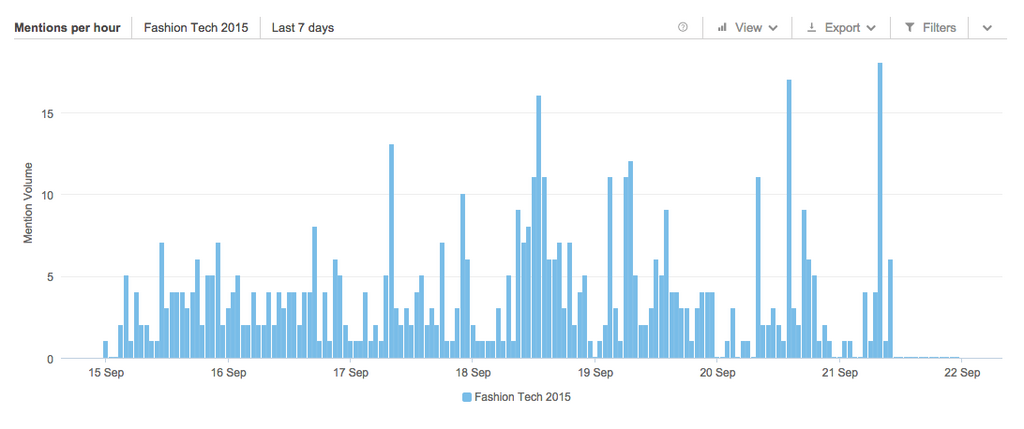
I spent a fair amount of time gathering influential Twitter accounts related to media, fashion, tech and, in particular, fashion tech – I wanted to see what the latest topics were within this milieu.
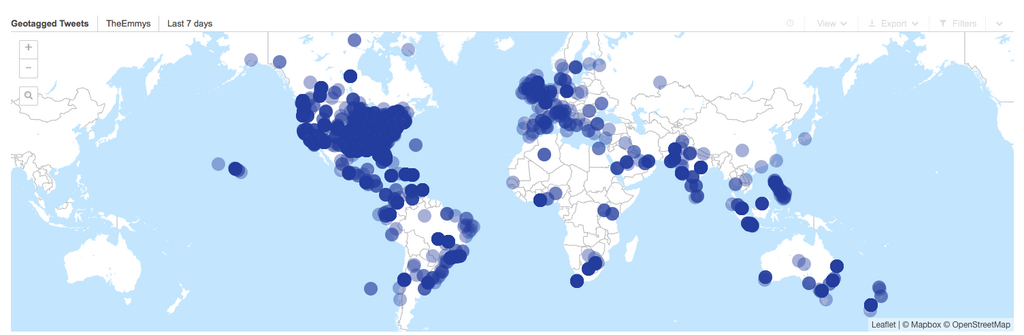
For instance, I applied a “fashion tech” Query to the Trends Dashboard and was able to see images, mentions and individual Twitter authors talking about “fashion tech” or using the hashtag #fashiontech.
Nat: While a single sheet PDF full of insights is helpful, the provision of a refined Dashboard provides current and actionable insight on-the-fly.
The days of static reports are passing and stakeholders at brands are increasingly curious about how to efficiently view and act upon real-time social data.
Many years ago, I turned in long reports with extensive appendices full of mentions. Now, the Trends Dashboard can provide brand teams with the right info at the right time.
For example, we can quickly discover key influencers in the fashion blogging world for content teams to work with or we can emphasize the need to participate in a specific trend during a global sales event for regional stakeholders.
“From strategic planning to product development, trends inform the whole business. The trends dashboard will enable us to identify and monitor trends in real time and serve up, through a dashboard or Vizia screens, insights directly to the people who can act on them.”
Stuart Diamond, Global Brand Insights Manager, C&J Clark International
Nat: The Trends Dashboard could be used by think tanks, lobbyists, policy makers, insights teams at brands, designers, marketing agencies, research centers, political parties, journalists, PR agencies, defense departments, intelligence agencies, anyone!
Imagine what an educator could do with the Trends Dashboard to prove their theory about better education.
Imagine what an energy planner could do with the trends dashboard to help humanity avoid a future catastrophe related to energy usage.
Imagine what a designer could come up with through finding a unique selling proposition hidden within the Trends Dashboard.
Imagine how a political party could gain an edge in an election.
I have been studying specific hashtags using Brandwatch and looking at the root or earliest instances of the use of these hashtags.
Specifically, I’ve been studying the individuals who “gave birth” to specific hashtags, in Twitter and Instagram.
I am looking for the reasons why these authors used these hashtags. One way to see this is to actually see what these authors were talking about in the weeks leading up to the first use of a specific hashtag. Who were they talking to? Where were they traveling/working? Who where they quoting or re-tweeting or sharing in their own feeds?
In successive Trends Dashboards, I’d love to find a method for seeing the birth of trends through analysis of “first usage” of topics or hashtags.
There are five tabs in the Trends Dashboard.
 Trending: Now React quickly to valuable marketing and PR opportunities as they happen. Instantly turn your Query into a real-time trend detection and analysis Dashboard. Track key topics or industries or monitor a specific hashtag or event to follow the most relevant conversations going on in the last 6 hours.
Log in to Brandwatch Analytics to start using the Trends Dashboard now, or get in touch with us to find out more.
Consumer Research gives you access to deep consumer insights from 100 million online sources and over 1.4 trillion posts.
By Matt TippetsNov 22 2024
By Matt TippetsNov 21 2024
Existing customer?Log in to access your existing Falcon products and data via the login menu on the top right of the page.New customer?You'll find the former Falcon products under 'Social Media Management' if you go to 'Our Suite' in the navigation.
Brandwatch acquired Paladin in March 2022. It's now called Influence, which is part of Brandwatch's Social Media Management solution.Want to access your Paladin account?Use the login menu at the top right corner.