


18 Social Media Holidays to Celebrate This August
By Yasmin PierreJul 6
Explore the live data behind football’s biggest global tournament.
Tweets with images have been found to get 150% more retweets than those without. Infographics are a great way of sharing lots of data in a single, eye-catching image. We’ve all seen them. But only professional designers can actually make them, right? And they must take ages to make!
Spend just 10 minutes on these free online tools and we think you’ll change your mind.
The cue is in the name here. Easel.ly starts you off with a small but stylish collection of “Vhemes” or themes that you can chose to play around with. Find one that you like the look of and start putting in your own text or images.
There are enough choices that you can make something uniquely yours but there’s not so much you’ll get overwhelmed. It forces you to keep things simple but eye-catching.
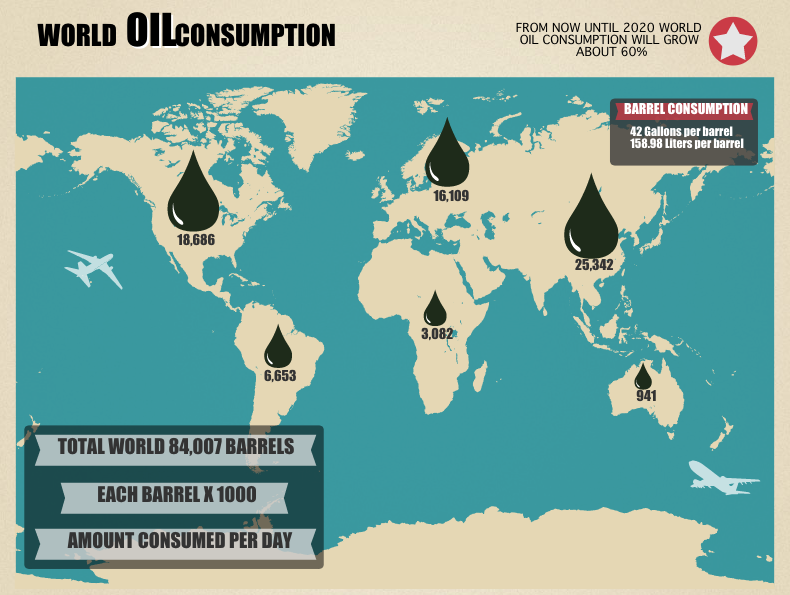
You can very quickly resize objects, pictures or text. There’s a useful collection of maps, people and icons that you can drag down from the top which are perfect for creating the sorts of infographics you are familiar with.
For a little extra professionalism try using the grid overlay to make sure your designs are properly aligned.
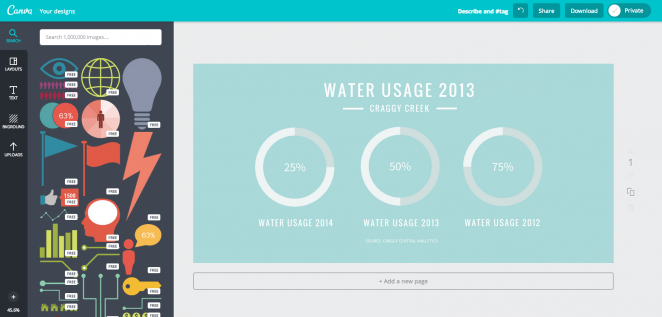
It’s about to make you feel like a designer of beautiful things too! With a vast array of pastel coloured banners and buttons at your disposal you’ll quickly be putting together a poster worthy of an iPhone app.
There are some really nice details in here. Resizing images is extremely intuitive for example. Drag the edge of a line of people and you get more people in the line rather than stretching the images and distorting them. No need to copy and paste and fiddle around with positioning. You can also change the primary colour of any element to match the rest at the click of a button.
Click on the ‘infographics’ icon when looking through images to get a great collection of useful arrows, charts and icons to tell your story. You can also search for images in the search bar at the top.
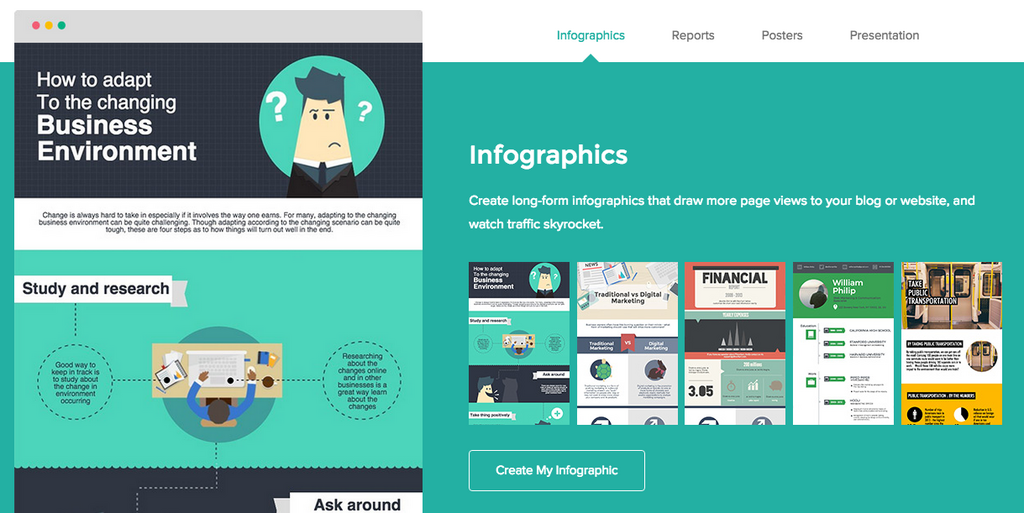
If you’ve got a whole load of data and insights that you want to share then Piktochart is the one for you. Slightly more sophisticated as far as charts go, it is nonetheless still super-simple to use.
There are 14 charts to chose from in the tools section for any occasion. Putting data into the chart-builder is extremely intuitive but you can also upload data from Google Spreadsheets or your computer. Each chart fits itself to the data you’ve put in. If you’ve ever made a chart on PowerPoint, it works in the same way.
There are also several maps to chose from if you have country-by-country or state-by-state data to show. The charts and the maps are all animated, allowing readers to hover over parts to get some extra data.
While the design element here is not as arresting as the others at first, you do have a considerable amount of control over how you want things to look. If you’re familiar with Hexadecimal colour codes you can pick the exact colour you want for any element of your infographic.
Piktochart is also laid out in ‘blocks’. You can add as many blocks as you like to, creating one of those long pages you may have seen info-heavy infographics displayed on.
As if that wasn’t enough, you can embed YouTube and Vimeo videos into your Piktochart. While not a traditional element of an infographic, you might want to play around with the possibilities of building your design around videos.
Consumer Research gives you access to deep consumer insights from 100 million online sources and over 1.4 trillion posts.
Existing customer?Log in to access your existing Falcon products and data via the login menu on the top right of the page.New customer?You'll find the former Falcon products under 'Social Media Management' if you go to 'Our Suite' in the navigation.
Brandwatch acquired Paladin in March 2022. It's now called Influence, which is part of Brandwatch's Social Media Management solution.Want to access your Paladin account?Use the login menu at the top right corner.