
Why you need to include APAC social data in your listening strategy
By Laura DelgadilloMay 27
Explore the live data behind football’s biggest global tournament.
Want to know what competitor intelligence is? We explain all and offer some tips and tools to get you started. Don't let your competitors get the jump on you.
Competitive intelligence is research and learnings about your competitors, used to understand and outperform them. It includes a vast range of data sources including focus groups, press monitoring, and digital approaches such as social listening.
For example, if I am going to start a new business, knowing who my competitors are is important. But more than that, knowing their marketing strategy, their share of voice, and what my potential customers think about them can give you the edge.
Especially if they’re not doing any competitive intelligence research themselves.
It should also be an important part of your company’s approach and culture. Our guide on creating a culture of competitive excellence explains why and how to do it.
As the definition suggests, competitive intelligence is pretty broad. Anything from having a quick wander around a rival shop to years long multi-channel monitoring fall under the same umbrella.
The following steps will help you focus your efforts and build out a plan that works for you.
This is the foundation everything else will be built on. You need to consider the following.
To start, find out how many competitors you actually have. You’ll probably know them off the top of your head already, but make sure there aren’t any hiding away.
Speak to your employees and customers, do regular searches on social and on Google. Keep an eye on any industry press, and the press in general.
This should be pretty light work. If your competitors’ marketing strategy is any good, they’ll make themselves heard anyway. But the sooner you’re aware of them the better.
The competitive intelligence approaches you choose will depend on your industry. For example, if your competitors get discussed a lot online, you’ll want to look at social media monitoring.
Conversations, sales, marketing, and all the rest, can be very different in different industries. There’s always some crossover in approaches, but a local restaurant is going to have vastly different priorities to a global pharmaceutical company.
This is important for knowing what ‘success’ actually looks like. A restaurant can see significant business results from good Facebook results, a huge pharma company might not.
And that brings us onto the kind of data you’re going to track and analyze. As we’ve stated, these will differ from business to business. Different companies rest on different metrics.
You should already have set KPIs for your business anyway, so these will work as a starting point. Some might be too broad to track, so see if there are any you can break down.
For example, if you’re looking at traffic to your website, breaking down by medium (search, social, referral, etc) can give a clearer picture.
Say you are a mid-sized PR firm, here’s some of the major things you’ll want to be tracking:
This isn’t an exhaustive list by any means, but it gives you an idea on how the industry and the business aims will set your metrics to track.
Now to get to getting the actual data.
There are a huge range of tools for competitive intelligence as there are so many different metrics to track, so we’ll go through some of the major types of tools to get you started.
Google is the biggest driver of traffic around, and there’s probably not a single industry out there that people aren’t searching about.
Tracking your own performance is fairly easy. You can use something like Google Analytics to track your traffic and see exactly how much of it comes from search engines and to what pages people go. Simple.
Obviously you can’t do that to your competitors. But you can use other tools to track how they rank on search engines and see where they’re beating you and get a general idea of the traffic levels they’re getting.
We use Ahrefs at Brandwatch, but there are a ton of tools out there. Moz is another good one, while Searchmetrics is a great shout for big agencies with lots of clients.
You can also do a bit of manual work by searching in Google yourself (our guide on Google search operators will help), but just remember this won’t always be accurate. Search results get personalised and differ from country to country.
This is our strong area. Social listening, or social media monitoring, allows you to track and analyze conversations across the internet to see what people are saying. Essentially you can turn the entire world into a personal focus group.
You can track specific brand names, general topics, specific accounts or websites, and pretty much anything else you can think of.
This can be great for monitoring share of voice among you and your competitors. You can always find out what’s being said about your and your rivals, while you can keep an eye on all of your competitor’s activity and content.
With a product like Brandwatch Analytics you can bring this all into your own customised competitive intelligence dashboard and easily monitor everything you need.
There’s a wealth of information in the press, whether it be positive or negative coverage. Knowing your competitor is caught up in a scandal means you can, responsibly, take advantage of it with some well-placed ads or content.
On the other hand if they’re getting good press, you need to know that too. Finding out not just what they did, but how they did it will help inform your own strategy. It will also stop you from getting left behind.
For a free tool, Google Alerts is a good way to track brand mentions around the internet. LexisNexis is a big set up allowing you to track print coverage too.
Your own situation will inform the kind of approach you need. For the more niche industries, it might just be a matter of doing it the old-fashioned way and reading the industry publications.
Old, new, and ex-customers are a goldmine for competitive intelligence. And so are your competitors’ clients obviously. Getting the chance to ask them a few questions can give you the kind of intimate intelligence you can’t get elsewhere.
Of course, if you’ve ever tried to get a lot of people to fill out surveys you’ll know how hard it is, even if it’s short. So a good tool can go a long way once you’ve got some people to interrogate.
Google Forms and Surveymonkey are good free shouts, with the latter having paid plans for extras too. There’s also Survey Anyplace who bring a gamified and entertaining approach to serious surveys.
Beyond tools, there’s range of other competitive intelligence activities to undertake to start getting your data. Again, your own situation will shape what will work, but here are some of the common ones to get you thinking about next steps:
Whether it’s a pub meet-up or a conference, industry events are a good way to learn about what your competitors are up to and to network with people who might have their own inside knowledge.
Companies often put on their own events local to their office. Keep an eye on their social channels for mentions of these. Attending means you can see what they’re up to, and the kind of people they’re targeting.
Industry conferences are perfect too. Obviously they’re good for networking (particularly for chatting to your rival’s customers), but your competitors might have stalls there or even have a speaking spot. All great ways to get some info on them, especially if you can get a sales pitch off them.
This refers to actually going out, or getting on the phone or internet, to dig up information on your competitors.
If they have physical locations, go out to them. Have a wander around, see the prices and the promotions. Find out how their staff act and sit through some sales pitches. Ask questions.
You can repeat this kind of thing with phone calls and internet research too. Go over their websites with a fine-toothed comb, check their social media presence, and get on Google to dig up any other info you can.
And, if they have any kind of call center, get through to that too and do what you’d do in the store. Get a feel for what angles they’re pushing, products they’re highlighting, and sales tactics they’re using.
Usually we find unending promotional emails annoying, but those emails are a great source of competitor information.
They’ll usually keep you updated on new promotions, but also give an insight into their wider marketing strategy and what they’re focusing on. In addition, you’ll get to see what kind of new tactics they might be trying.
In other words, sign up to every mailing list and alert your competitors have. Download all of their reports and guides. Sign up to their apps and actually use them. Join their forums. Follow their Twitter and Facebook accounts.
If they have any external communications, you want to be aware of it all.
Data is pretty much useless sitting on its own. Too often companies collect all the data they can, but then never know what to do with it. Here are three steps for getting some value out of your hard work:
First things first. Clean up your data and get it into a state that’s sensible and easy to understand. Poor and inconsistent formatting and labelling is a nightmare. This data cleaning 101 will get you on your way.
Next you want to get all your data from every disparate source up next to each other. One big spreadsheet with multiple tables is always preferable to 20 separate ones.
Get your data into suitable categories and see what datasets work side-by-side. See what can be compared to get valuable insights and generally just get everything in order.
Once you’ve got your data it’s time to get it into charts and visualizations that make it easier to understand and analyze.
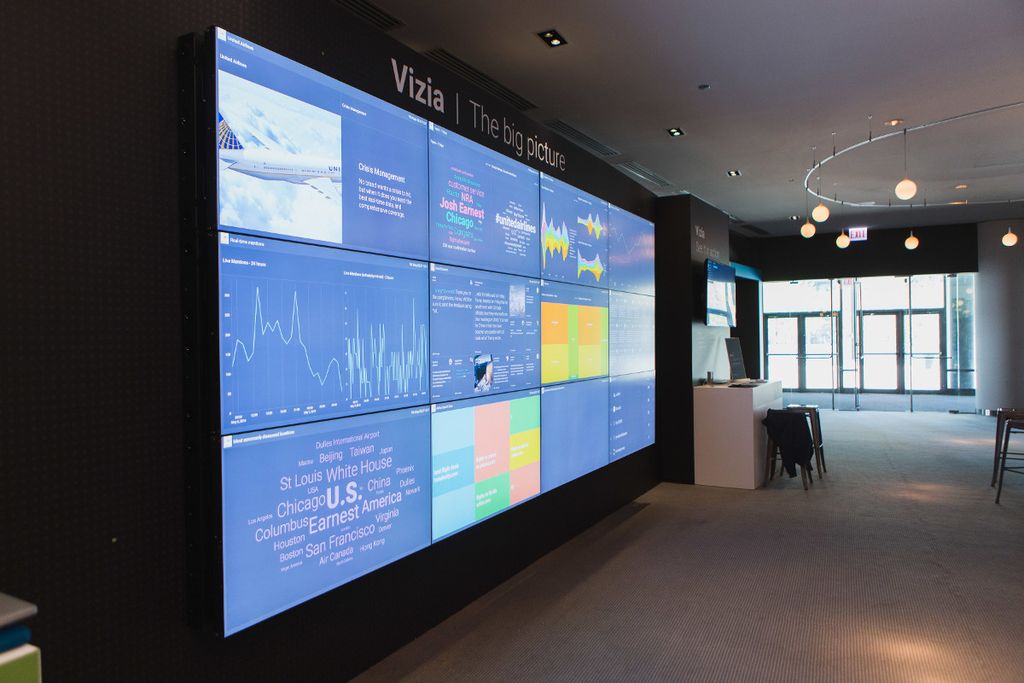
If you’re dealing with live data, such as search data or share of voice, you’ll want something that updates automatically. Brandwatch Vizia is excellent at this and has a ton of different data sources you can visualize against one another, including your own business data.
Remember that data visualization is very hard to get right. Keep things clean, consistent, and easy to understand. Don’t get flashy for the sake of it.
Finally, data won’t do much good for your business if only you see it. Employees from all departments can make use of competitive intelligence.
From frontline sales to the CEO, knowing what your competitors have done, are doing, and are about to do is important. It can inform sales pitches all the way up to long-term strategy.
Office screens visualizing your data help everyone get eyes on them. This is something that’s done by many of our clients using Vizia.
Whether you can do that or not, meetings and internal communication are also important for communicating your data. Think about who will benefit from seeing what information and ensure they get it.
It’s also worth considering making all the data available so that, if people want to, they can find the information they need.
Make it clear to everyone what data you have. They’ll tell you what they want to see.
Bring your social and marketing insights to life across your organization

Existing customer?Log in to access your existing Falcon products and data via the login menu on the top right of the page.New customer?You'll find the former Falcon products under 'Social Media Management' if you go to 'Our Suite' in the navigation.
Brandwatch acquired Paladin in March 2022. It's now called Influence, which is part of Brandwatch's Social Media Management solution.Want to access your Paladin account?Use the login menu at the top right corner.