Is an average engagement rate of 10% good or bad? 

For a tech company, this figure could mean you are an industry leader. However, if you’re in media and entertainment, it might indicate that you’re falling behind your competitors. 

To evaluate the impact of your social media efforts, you need to understand where you stand against key players in your market. This is where benchmarks come in handy. Benchmarks help you compare your brand against competitors and industry leaders to tell you where you stand and where you might need to go. 

A quick note on methodology

Using Brandwatch’s social media benchmarking tool, Benchmark, we’ve analyzed the social media performance of over 600 brands across 12 industries to provide you with the key social media benchmarks by industry for Q1 of 2024.

What are social media benchmarks?

Social media benchmarks serve as a reference for evaluating performance within a particular industry or sector. Benchmarks can come from your competitors, past performance, or industry. By utilizing any of these social media benchmarks, you can set clear and realistic social media goals and effectively measure your KPIs. 

How can you calculate social media benchmarks?

Measuring industry averages requires a systematic approach that is basically impossible to do manually, given the number of brands you need to analyze and the challenges in gathering data from non-owned brand profiles.

Using Benchmark, you can easily compare any brand against competitors or industry leaders at any given period. It has a database of 300,000 brand profiles across Facebook, Instagram, X, and YouTube to benchmark against. 

For this blog post, we analyzed 50 influential brands per industry, with a good mix of global and regional brand profiles where relevant. We assessed the average value for each of the metrics. In some cases, we considered the median value to prevent outliers from influencing the results (meaning brands with an unusually high number of posts or videos).

We used the following formulas for the calculation of the engagement rate for each network:

  • FB engagement rate = Total interactions / Estimated reach) x 100%
  • IG engagement rate: (Total interactions / Estimated reach) x 100%
  • X engagement rate: (Total interactions / Followers) x 100%

Let’s go through the benchmarks for each industry – or jump to the relevant section for you. 

Automotive

Facebook

  • Facebook Page impressions: 10,824,545
  • Facebook audience growth rate: 0.67%
  • Facebook post engagement rate: 1.15%
  • Facebook posting frequency: 15 posts per month

X (formerly Twitter)

  • X post likes: 32,040
  • X audience growth rate: 0.27%
  • X post engagement rate: 0.14%
  • X posting frequency: 64 posts per month

Instagram

  • Instagram profile impressions: 92,597,551
  • Instagram audience growth rate: 1.67%
  • Instagram post engagement rate: 6.88%
  • Instagram posting frequency: 24 posts per month

YouTube

  • YouTube new channel views: 882,121
  • YouTube audience growth rate: 1.33%
  • YouTube video likes: 30,540
  • YouTube posting frequency: 11 videos per month
  • Average video duration: 4.27 minutes 

Back to the full list or visit our latest report on trends in the automotive industry.

Computer Software and Electronics

Facebook

  • Facebook Page impressions: 6,287,052
  • Facebook audience growth rate: 0.51%
  • Facebook post engagement rate: 0.67%
  • Facebook posting frequency: 20 posts per month

X (formerly Twitter)

  • X post likes: 106,491
  • X audience growth rate: 0.54%
  • X post engagement rate: 0.21%
  • X posting frequency: 57 posts per month

Instagram

  • Instagram profile impressions: 10,779,032
  • Instagram audience growth rate: 2.09%
  • Instagram post engagement rate: 9.01%
  • Instagram posting frequency: 22 posts per month

YouTube

  • YouTube new channel views: 15,115,146 
  • YouTube audience growth rate: 4.80%
  • YouTube video likes: 166,557
  • YouTube posting frequency: 20 videos per month
  • Average video duration: 5.65 minutes 

Back to the full list

Entertainment

Facebook

  • Facebook Page impressions: 103,345,970
  • Facebook audience growth rate: -0.99%
  • Facebook post engagement rate: 0.84%
  • Facebook posting frequency: 111 posts per month

X (formerly Twitter)

  • X post likes: 409,302
  • X audience growth rate: 0.32%
  • X post engagement rate: 0.14%
  • X posting frequency: 142 posts per month

Instagram

  • Instagram profile impressions: 51,417,474
  • Instagram audience growth rate: 1.24%
  • Instagram post engagement rate: 35.28%
  • Instagram posting frequency: 36 posts per month

YouTube

  • YouTube new channel views: 53,871,070
  • YouTube audience growth rate: 2.24%
  • YouTube video likes: 814,127
  • YouTube posting frequency: 28 videos per month
  • Average video duration: 4.06 minutes 

Back to the full list or read our latest report on trends in the media and entertainment industry

Financial Services and Banks

Facebook

  • Facebook Page impressions: 4,139,853
  • Facebook audience growth rate: 0.41%
  • Facebook post engagement rate: 1.03%
  • Facebook posting frequency: 18 posts per month

X (formerly Twitter)

  • X post likes: 37,119
  • X audience growth rate: 0.72%
  • X post engagement rate: 0.08%
  • X posting frequency: 54 posts per month

Instagram

  • Instagram profile impressions: 1,569,542
  • Instagram audience growth rate: 3.54%
  • Instagram post engagement rate: 6.64%
  • Instagram posting frequency: 23 posts per month

YouTube

  • YouTube new channel views: 14,138,405
  • YouTube audience growth rate: 6.83%
  • YouTube video likes: 26,128
  • YouTube posting frequency: 12 videos per month
  • Average video duration: 3.09 minutes 

Back to the full list or read our latest report on trends in the financial services industry

Food and Beverage

Facebook

  • Facebook Page impressions: 1,823,303
  • Facebook audience growth rate: -0.52%
  • Facebook post engagement rate: 0.59 %
  • Facebook posting frequency: 5 posts per month

X (formerly Twitter)

  • X post likes: 11,121
  • X audience growth rate: -0.29%
  • X post engagement rate: 0.15%
  • X posting quarterly: 10 posts per month

Instagram

  • Instagram profile impressions: 13,169,069
  • Instagram audience growth rate: 1.74%
  • Instagram post engagement rate: 6.61%
  • Instagram posting frequency: 22 posts per month

YouTube

  • YouTube channel views: 27,563,911
  • YouTube audience growth rate: 1.60%
  • YouTube video likes: 620,602
  • YouTube posting frequency: 6 videos per month
  • Average video duration: 29 seconds 

Back to the full list

Government

Facebook

  • Facebook Page impressions: 13,526,449
  • Facebook audience growth rate: 1.01%
  • Facebook post engagement rate: 3.19%
  • Facebook posting frequency: 8 posts per month

X (formerly Twitter)

  • X post likes: 24,641
  • X audience growth rate: 0.92%
  • X post engagement rate: 0.25%
  • X posting frequency: 74 posts per month

Instagram

  • Instagram profile impressions: 1,996,953
  • Instagram audience growth rate: 2.74%
  • Instagram post engagement rate: 6.74%
  • Instagram posting frequency: 31 posts per month

YouTube

  • YouTube new channel views: 4,431,872
  • YouTube audience growth rate: 4.16%
  • YouTube video likes: 233,441
  • YouTube posting frequency: 23 videos per month
  • Average video duration: 32.6 minutes 

Back to the full list

Online Media

Facebook

  • Facebook Page impressions: 151,156,411
  • Facebook audience growth rate: -0.11%
  • Facebook post engagement rate: 0.68%
  • Facebook posting frequency: 463 posts per month

X (formerly Twitter)

  • X post likes: 906,545
  • X audience growth rate: 0.61%
  • X post engagement rate: 0.04%
  • X posting frequency: 168 posts per month

Instagram

  • Instagram profile impressions: 32,019,050
  • Instagram audience growth rate: 0.93%
  • Instagram post engagement rate: 15.34%
  • Instagram posting frequency: 163 posts per month

YouTube

  • YouTube new channel views: 28,582,078
  • YouTube audience growth rate: 2.61%
  • YouTube video likes: 460,681
  • YouTube posting frequency: 35 videos per month
  • Average video duration: 6.2 minutes

Back to the full list

Pharma and Healthcare

Facebook

  • Facebook Page impressions: 2,570,929
  • Facebook audience growth rate: -0.01%
  • Facebook post engagement rate: 0.57%
  • Facebook posting frequency: 32 posts per month

X (formerly Twitter)

  • X post likes: 4,743
  • X audience growth rate: 0.07%
  • X post engagement rate: 0.08%
  • X posting quarterly: 43 posts per month

Instagram

  • Instagram profile impressions: 617,626
  • Instagram audience growth rate: 3.58%
  • Instagram post engagement rate: 7.83%
  • Instagram posting frequency: 18 posts per month

YouTube

  • YouTube channel views: 8,845,993
  • YouTube audience growth rate: 2.98%
  • YouTube video likes: 1,393
  • YouTube posting frequency: 11 videos per month
  • Average video duration: 6.72 minutes

Back to the full list

Professional Services

Facebook

  • Facebook Page impressions: 747,087
  • Facebook audience growth rate: 0.34%
  • Facebook post engagement rate: 0.72%
  • Facebook posting frequency: 19 posts per month

X (formerly Twitter)

  • X post likes: 5,940
  • X audience growth rate: 0.06%
  • X post engagement rate: 0.07%
  • X posting frequency: 25 posts per month

Instagram

  • Instagram profile impressions: 3,893,047
  • Instagram audience growth rate: 4.06%
  • Instagram post engagement rate: 5.86%
  • Instagram posting frequency: 20 posts per month

YouTube

  • YouTube new channel views: 1,548,488
  • YouTube audience growth rate: 2.66%
  • YouTube video likes: 3,435
  • YouTube posting frequency: 12 videos per month
  • Average video duration: 6.85 minutes 

Back to the full list

Retail

Facebook

  • Facebook Page impressions: 6,325,176
  • Facebook audience growth rate: 0.05%
  • Facebook post engagement rate: 0.61%
  • Facebook posting frequency: 16 posts per month

X (formerly Twitter)

  • X post likes: 29,568
  • X audience growth rate: -0.21%
  • X post engagement rate: 0.22%
  • X posting frequency: 14 posts per month

Instagram

  • Instagram profile impressions: 49,247,227
  • Instagram audience growth rate: 0.89%
  • Instagram post engagement rate: 6.40%
  • Instagram posting frequency: 33 posts per month

YouTube

  • YouTube new channel views: 15,034,099
  • YouTube audience growth rate: 2.02%
  • YouTube video likes: 46,566
  • YouTube posting frequency: 52 videos per month
  • Average video duration: 5.37 seconds 

Go back to the full list or visit our latest report on trends in the retail industry.

Schools and Education

Facebook

  • Facebook Page impressions: 10,103,150
  • Facebook audience growth rate: 0.20%
  • Facebook post engagement rate: 1.17%
  • Facebook posting frequency: 42 posts per month

X (formerly Twitter)

  • X post likes: 45,242
  • X audience growth rate: 0.58%
  • X post engagement rate: 0.15%
  • X posting frequency: 53 posts per month

Instagram

  • Instagram profile impressions: 4,135,770
  • Instagram audience growth rate: 4.44%
  • Instagram post engagement rate: 12.25%
  • Instagram posting frequency: 21 posts per month

YouTube

  • YouTube new channel views: 1,815,134
  • YouTube audience growth rate: 2.68%
  • YouTube video likes: 18,835
  • YouTube posting frequency: 12 videos per month
  • Average video duration: 11.62 minutes 

Back to the full list

Travel and Tourism

Facebook

  • Facebook Page impressions: 4,931,053
  • Facebook audience growth rate: 0.22%
  • Facebook post engagement rate: 0.78%
  • Facebook posting frequency: 15 posts per month

X (formerly Twitter)

  • X post likes: 9,139
  • X audience growth rate: -0.14%
  • X post engagement rate: 0.03%
  • X posting frequency: 47 posts per month

Instagram

  • Instagram profile impressions: 7,128,648
  • Instagram audience growth rate: 2.25%
  • Instagram post engagement rate: 15.09%
  • Instagram posting frequency: 36 posts per month

YouTube

  • YouTube new channel views: 11,888,948
  • YouTube audience growth rate: 1.99%
  • YouTube video likes: 35,564
  • YouTube posting frequency: 7 videos per month
  • Average video duration: 4.29 minutes

Back to the full list

How can you best utilize social media benchmarks?

1. Set realistic goals for social media performance

You never operate in a vacuum, and having insights into the performance standards of your competitors and industry leaders will provide you with context and allow you to challenge your own performance. 

By leveraging industry benchmarks, you can learn where you’re ahead and where you’re falling behind. 

Imagine you're in the Pharma and Healthcare sector, aspiring for a 20% Instagram engagement rate. Utilizing industry-average data can provide perspective, helping you gauge if that target aligns with industry norms. This informed approach allows you to set a more realistic and achievable KPI.

2. Understand your own performance better

It can be difficult to measure ROI for social media, but benchmarks are a great way to measure your social media efforts. When you’re reporting on your social media results, include competitor and industry benchmarking data to understand your performance relative to industry peers. 

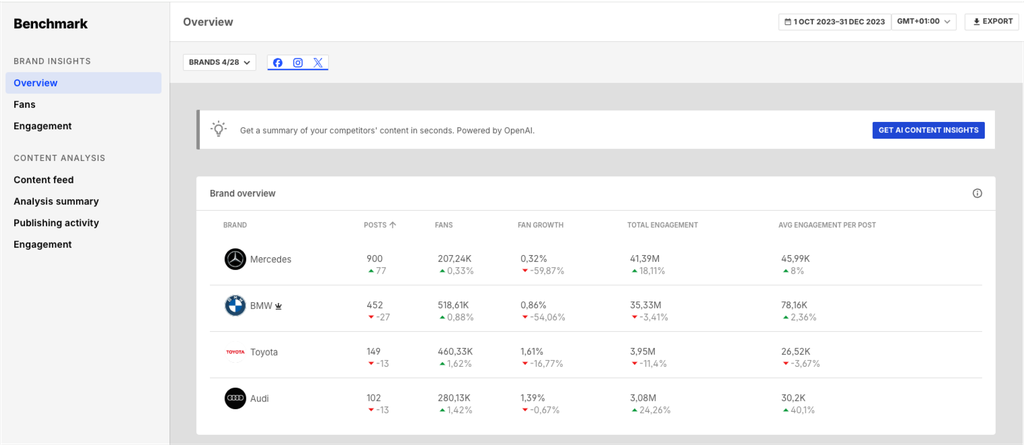
With Benchmark, you can analyze your brand against your competitors, and track and compare metrics such as audience growth, posting volume, engagement, and SOV at any given period, helping you evaluate your results with additional context. 

3. Learn from your competitors and industry leaders

Competitor and industry intel can serve as inspiration for your social media content strategy. 

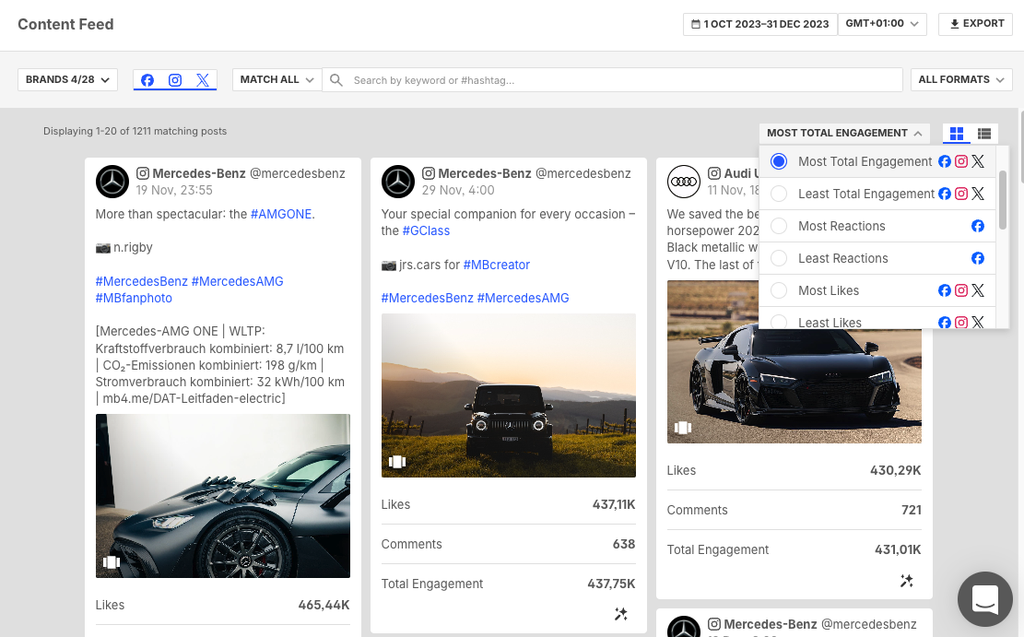
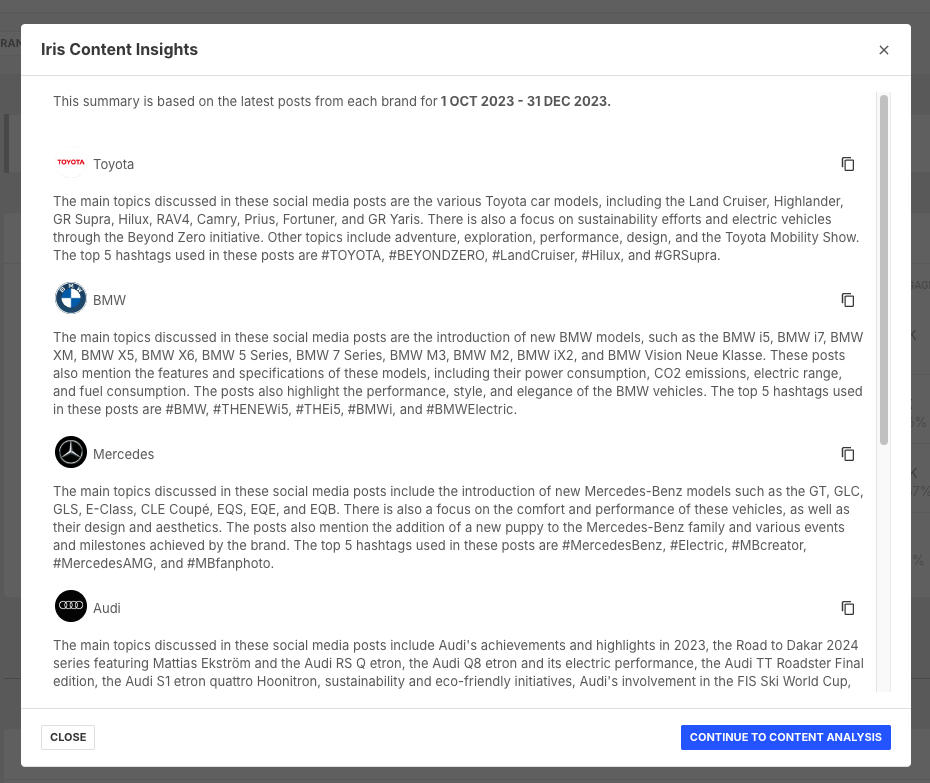
Again, Benchmark can help you easily find the best performing posts, post types, hashtags, and campaigns of your competitors. You can then run AI-powered summaries to learn what’s driving their success.

You can use these insights to inform your next social media campaign and refine your content strategy. 

To explore and leverage the power of competitor and industry analysis, book a demo for Benchmark.