18 Social Media Holidays to Celebrate This August
By Yasmin PierreJul 6
Explore the live data behind football’s biggest global tournament.
Experts from teams across Brandwatch discuss how creativity and social data can go hand in hand. Learn about the important balance to be struck between plausibility and creative data exploration.
When I talk to people about my job analyzing social data, they rarely look excited. To be fair, if your only experience of “analyzing data” is a repetitive Excel task you were made to do at school or in your first job then I can understand why. But the reality of my job goes way beyond moving numbers around in Excel.
When I explain that I use tools to find out what people are saying about big events and items from pop culture then write stories about the numbers, they lighten up a little. It makes more sense and it sounds human and creative, which is a lot more exciting than the concept of formulas and pivot tables.
I joined Brandwatch as a social data journalist because I was excited by the exclusive data the company could provide and how it told people things they didn’t know before. Brandwatch can measure massive swathes of people’s voices in incredible ways.
Being let loose on Brandwatch Analytics to explore the subjects that I think people will find interesting is really rewarding. I’ve written about the presidential candidates people dream about most, looked at pizza consumption patterns in New York and worked out which episodes of Black Mirror people find most disturbing. The possibilities are pretty much endless.
The data is messy because it’s just totally unfiltered thought from people of all walks of life. This blog post is about the beauty of social data and the creative ways it can be used, but also the balance that must be struck between the plausibility of findings and the disruptive insights it can reveal.
There are two ways to investigate a subject with social data. You can start broad and see what you find, or you can go in with a specific question or hypothesis.
Using this method, you begin with a very broad idea about what you’d like to look at – what people are saying about Black Mirror, for example.
Then you create a broad spanning query that searches for mentions of your chosen topic (perhaps on a sample depending on your mention limit) and dive into the data. In Brandwatch, I’d recommend starting with a summary dashboard that can immediately give you top-line stats and topics.
Straight away you might notice that women are tweeting about Black Mirror more than men, or that one of the biggest words in the topic cloud is “terrifying”. Questions will come from spotting these things – why are women posting about the show more? Which episodes are making people most scared? Why was there a spike in mentions on this day? Who’s driving all this conversation? Then you can start to explore further.
As you look through snippets and other data points you’ll find more and more questions and be able to look for more answers. Remember to try to challenge your assumptions about what you thought this audience or conversation would look like.
The beauty of this method is that you don’t need to decide scope before you begin and there are endless possibilities to segment the data however you like.
Starting broad is a good idea if you’ve got time to look. Starting with a more specific focus like a question or assumption to challenge will, of course, help you get to the insights you need quicker.
For example, I wanted to know how much free exposure Starbucks were getting from baristas spelling people’s names wrong on cups, and working with text and image queries that’s exactly what I did.
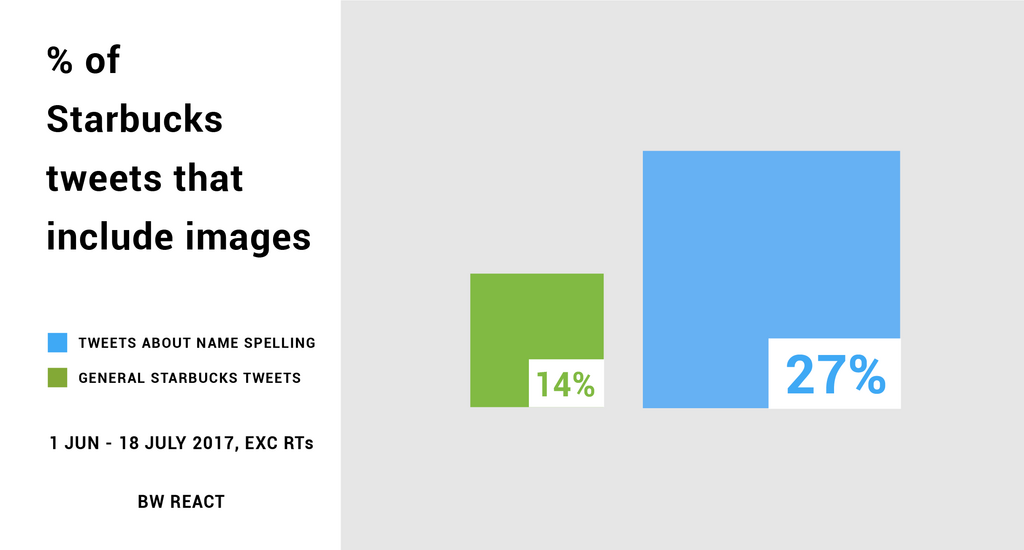 Brandwatch found that a huge chunk of tweets about Starbucks employees spelling people’s names wrong contained images, many of which contained tasty looking Frappuccinos. Meanwhile, tweets about Starbucks that were not specifically about name spelling were far less likely to contain an image.
Of course, the inspiration for your question could come from anywhere. Our dream research idea came from someone tweeting at us. Our Starbucks research idea came from our own experiences. Your own questions might come from uncertainty around pressing business decisions or the angle of a new campaign.
However you’re looking at the data, remember to look for the unexpected.
The bottom up, exploratory and arguably creative approach to data analysis is one of my favorite ways to use Brandwatch. It can measure massive swathes of people’s voices in incredible and unexpected ways.
These unexpected findings are key to pulling out insights. As Isaac Asimov said:
The most exciting phrase in science is not ‘Eureka!’ but ‘That’s funny’
I recently spoke to Brandwatch’s Head of Data Science Hamish Morgan about how I might present some figures around the countries in the world that use the most heart emojis on Valentines Day. We discussed the different ways we could structure the list based on the data we had, and during our discussion (in which I said that one way seemed less plausible) he said:
Plausibility is the enemy of insight.
I put the quote to a few colleagues who were not only impressed by how smart it sounded but also nodded in agreement.
The strength of social data is not in the ways that it reflects the assumptions we already have but in how it casts light on new an unexpected things. If we only look at the data through the lenses of what is plausible based on our previous assumptions, we’re not going to get anything out of it.
“You don’t go after what you’re looking for, you go after what you don’t know.”
Looking at the data in a broad way gives you an extra advantage when looking for the unexpected. Compare it to a survey where you ask questions to which there are only a certain number of answers, meaning you’ll never get results that tell you something you don’t already have a concept of.
Diving into social data without filtering it can give you access to that which you don’t already know about and haven’t searched for intentionally.
I spoke to Senior Research Analyst Peter Fairfax about looking for the unexpected in social data. He regularly presents data to clients and says that it’s the surprises that get them most interested in what he has to say.
The smaller things are surprising – the little unexpected bits are what get clients most excited. Try not to focus on the top level too much – generally, that stuff is obvious and doesn’t tend to be as insightful as the findings that make the data so unique
Of course, there is a limit to how creative you can be when presenting on important business decisions. Getting the balance right between looking for likely connections and exploring the weird and wonderful is key.
Unless you think there’s at least a small chance of two facts being related, don’t spend too long digging around totally implausible questions (for example, is there a meaningful relationship between how many cacti we include in the background of our soda social media ads and the number of people who tweet that they want soda?) It’s so unlikely that this could be causation over correlation, and you’re not likely to pull out any real insights.
If you find something compelling and unexpected but it looks pretty implausible, try using other research methods to dispel or verify your findings, Peter suggests.
Also, be careful not to totally ignore top level stats like mentions over time – you might notice significant differences in the times people are posting about something year on year and could find new opportunities where interest in something is high but promotion of that thing is low.
We wrote recently on presenting social data to different audiences, particularly in business meetings, but didn’t go so far into the balance between plausible and implausible insights.
In my work, I am often faced with difficult decisions when trying to think of what kinds of insights to present. For example, I often post social data infused articles on Reddit but whether I post the most unexpected part of the research or the most expected part of the research is not always an easy decision. Here are two examples of Brandwatch articles posted on Reddit’s r/dataisbeautiful.

 Both made it to the front page and bought in thousands of views on the article, however the United article isn’t exactly a headline with an “unexpected” twist – everyone knew that the airline was getting lots of mentions.
Meanwhile, the “Mario’s nipples” post is certainly random and arguably unexpected since Super Mario has both male and female fans.
While the United article was totally “plausible” I think its success was down to it reaffirming people’s beliefs (basically, that it was a huge PR crisis). It was proof that all of the Reddit posts and tweets people were seeing accumulated into a “big thing”.
Meanwhile, the “Mario’s nipples” post was timely and fresh and amusing and unexpected, and I think that’s why it also did so well. In fact, it brought in around 200k unique page views to the Brandwatch site in a 48 hour period – a new record.
My point here is that plausible findings can be used to back up other research and opinions, but the surprising findings are where social data really shows its worth.
Existing customer?Log in to access your existing Falcon products and data via the login menu on the top right of the page.New customer?You'll find the former Falcon products under 'Social Media Management' if you go to 'Our Suite' in the navigation.
Brandwatch acquired Paladin in March 2022. It's now called Influence, which is part of Brandwatch's Social Media Management solution.Want to access your Paladin account?Use the login menu at the top right corner.